-
News & Updates
careering
June 15, 2017
Which Countries Destroy The Environment The Most (And Least)?
This article originally appeared on Priceonomics.
In 1970, people first used more environmental resources than the world could produce.
The gap between demand and nature’s ability to meet that demand has grown steadily since then. Each year we live in ecological deficit–taking more than can be replenished–we draw down the world’s reserves of natural resources. Ensuring we don’t use up the world’s resources is a global effort, though some countries use up more resources than others.
We wanted to know what countries were the heaviest users
of environmental resources, and which ones have the lightest footprint.
We used data from Priceonomics customer data.world, a platform that ties many different data sets together so it’s easy to analyze them. In particular we analyzed a data set from Global Footprint Network–a research group dedicated to helping leaders in government and finance quantify how much people take from nature and how much nature has to give. The 2017 edition of the National Footprint Accounts contains data from 1961 through 2013, and is available on data.world, where you can query, download, and comment on the data.
Not surprisingly, we found that on average people across the world use vastly more resources than nature can replace.
Countries in Western Europe, East Asia and oil-producing countries typically run the largest per person deficits. Luxembourg has a per person deficit 10 times larger than the world average. Sparsely populated and densely forested South American countries like Guyana, Suriname and French Guiana have the largest per person surpluses.
We saw that a country’s affluence is a strong predictor of its natural resource consumption. Looking just at the 50 largest economies, Canada is the most environmentally responsible and South Korea the least. Of these large economies, the United States has the second worst environmental track record.
***
Ecological footprint measures how much biologically productive area a country needs to fuel its resource consumption and absorb its waste.
The more fruits, vegetables and grains a country consumes the more farmland it needs to supply that demand. The more animal product it consumes, the more fishing and grazing area it needs. The more carbon emissions it puts out, the more land it needs to pull that carbon back out of the atmosphere and trap it. If you’re concerned with the environment, having a large ecological footprint is a big negative.
On the other hand, “biocapacity” is a positive for the environment. Biocapacity measures how much a country’s land and water can produce.
Densely forested land can be logged for lumber, or left to convert carbon in the air into leaves and stems on the ground. Farmers need land to grow crops or raise livestock. How much the land can provide depends on both how rich it is, and what people use it for.
Both ecological footprint and biocapacity are measured in a common unit, global hectares. A global hectare is the average amount of resources a hectare (roughly two and a half acres) of productive land produces.
We began by looking at total resource consumption to see which countries have the largest (and smallest) ecological footprints. The biggest consumers are among the most populous, most expansive, and most developed countries in the world. Small island countries make up the other extreme.

Data source: data.world and GFN
The absolute amount of demand falls rapidly the further down the list. The United States ranks second largest, with just over half the demand of number one China. India, the next largest, consumes about half what the United States does. Two more spots down the list, Japan comes in at fifth largest with half the demand of India. Rounding out the top 10, the United Kingdom has a footprint half the size of Japan’s footprint–and roughly one-sixteenth the size of China’s footprint.
It’s not very surprising, however, that countries with the most people also have the largest footprints. But if you control for population, which countries use the most per person?

Data source: data.world and GFN
Luxembourg, a country with a little over half a million people and just under a thousand square miles, sits atop the list. Each Luxembourger uses the equivalent of 13.092 hectares of productive land. The bottom 10 countries, on the other hand, need less than one global hectare per person. It takes approximately 26 Eritreans to match one Luxembourger’s ecological footprint. Island countries, such as Timor-Leste in the south Pacific or Trinidad and Tobago in the Caribbean, show up at both extremes.
Countries use natural resources in different ways. Different spending habits means a country has to sacrifice different things to start living within its means again. We found the 10 countries that put the largest burden on the earth, and show how they spend their resources.

Data source: data.world and GFN
Carbon emissions are the largest demand most countries place on natural resources. Typically discussions about carbon emissions revolve around tons of carbon. The ecological footprint measures carbon in the amount of productive land and sea needed to pull the carbon out of the air. Indonesia and Brazil place a heavier burden on their resources for food production than removing carbon. For the 10 countries with the largest footprint, growing food makes up the second largest part of demand.
***
Consumption is only half of the equation. A country that consumes less than it produces will have resources to export. So, which countries are rich in environmental resources and don’t have large ecological footprints?
To begin with, we investigated who had the most in terms of sheer natural resources. The table below shows the countries with the most and least biocapacity:

Data source: data.world and GFN
As could be expected, many of the countries that have the most productive land are also some of the largest countries by area. Eight out of 10 are also in the 10 largest countries by area. Indonesia and the Democratic Republic of Congo are the two that fall below top 10 by area. Like we’ve seen above, the chart of the least biocapacity is a list of the smallest island countries.
Sorting countries by the amount of resources their populations use on average drastically changes who comes out on top. Many of the largest, most resource rich countries also happen to have large populations.

Data source: data.world and GFN
Citizens of large, sparsely populated countries, such as those of French Guiana, have their footprints made up for several times over by the lush vegetation in their countries. A couple of the countries that top the list of ecological consumers–Australia and Canada–appear in the top 10 for most biocapacity as well. Densely populated and sparsely-vegetated countries like Singapore and Jordan have few resources to spread across their populations.
Several different resources contribute to a country’s overall biocapacity. Managing these resources helps countries remain as overall producers of biocapacity. We looked at the 10 countries that replenish the most resources to see how they break down.

Data source: data.world and GFN
Forest land is capable of absorbing large amounts of carbon. The forests in the Congo and Brazil, two of the most resource rich countries, generate over three quarters of their available natural resources. Land used for food production–growing crops, raising livestock, or fishing–provides over half of the resources available from six of the ten most resource rich countries. Built-up land contributes a nearly negligible portion.
After ranking countries by the size of their demand for natural resources and the size of the country’s ability to produce and replenish those resources, we wanted to know which countries live within their ecological means, and which countries rack up ecological debt.
To do this, we subtracted a country’s ecological footprint (how much it takes from the environment) from its biocapacity (how much it puts back into the environment) to find its net biocapacity in global hectares per person. Below are the top ecological creditors and debtors ranked by net per capita footprint.

Data source: data.world and GFN
South American countries like French Guiana and Suriname contribute the most net biocapacity per person. Forests are highly productive in terms of natural resources. More than just the goods that come from forests, they consume and trap carbon. However, those countries are fairly small and consume a fraction of what the most resource-hungry countries consume.
Our next list features the other end of the spectrum, the biggest ecological debtors.

Data source: data.world and GFN
Luxembourg, a micronation neighboring Germany, ranks number one with an 11.51 global hectare per person deficit. Singapore, Belgium, South Korea, the Netherlands, Japan, Switzerland, Malta and the United Kingdom all place in the top 25 biggest ecological debtors. Oil producing countries such as Qatar, Kuwait, Bahrain, Saudi Arabia, Oman and Libya also rank highly.
***
We wondered if a country’s affluence was related to the amount of natural resources it could consume. Are the countries that don’t destroy the environment simply the ones who haven’t yet built up their economies?
We plotted the size of the ecological footprint against Gross Domestic Product (GDP) for each country. There’s a large amount of inequality in how GDP and ecological footprint are distributed, with the top few accounting for as much as all the rest combined. To keep those outliers at the top from distorting the picture, we performed a log transformation on both sets of numbers.

Data source: data.world and GFN
Countries that use the most resources typically have the highest GDP, while countries with low GDPs generally use the least resources. The correlation between the two is strong and positive — footprint increases as GDP increases. We fit a linear regression from GDP to footprint. It has an r-squared value of .843–GDP explains the vast majority of the variation in ecological footprint.
With GDP explaining so much of how much a country consumes, we wanted to see how the 50 largest economies performed. Positive numbers indicate an ecological surplus. People in those countries consume less than nature replenishes. Negative numbers show a deficit, where people consume more than their land can support.

Data source: data.world and GFN
Canada is the most environmentally friendly major economy and tops the list with 7.42 global hectares per person of surplus. There are 13 countries from the 50 largest that produce surplus; the remainder take more than they put back. South Korea rounds out the bottom of the list with a 5.19 global hectares per person deficit. The United States has the second worst environmental track record by this measure.
Ecological footprint provides an accounting system for comparing the effect on our ecological account balance of many different types of human activity, such as weighing deforestation in the Amazon against the adoption of renewable energy sources in the United States. Bringing our global demand for biological resources back in line with what the earth can support has different implications for different countries.
As it turns out, having a large economy is a very good predictor you’ll be consuming more of the environment than you replace. As countries look to grow, the trend of environmental destruction will likely continue unless these countries take action to change course.
Source: Visual News
June 14, 2017
Your Microwave Isn’t Listening, But These Devices Are
- 88% of Americans say it is important that they not have someone watch or listen to them without their permission.
- However, the demand for voice-first devices (like Alexa or Echo) is expected to grow from 6.5 million in 2016 to nearly 25 million this year.
- Hackers, government agencies, and online companies might have access to your data/info if you’re not taking the proper steps to protect yourself.

Source: Visual News
June 14, 2017
PremiumBeat.com
This Facebook post is no longer available. It may have been removed or the privacy settings of the post may have changed.;
Source: CW’s Flipboard Feed
June 13, 2017
Apply to Participate on June 26: PanelPicker, Film Submissions, Music Showcases, and More

Be a part of one of the most diverse, collaborative, and inventive communities in the world! SXSW 2018 applications open on Monday, June 26 for PanelPicker, SXSW Film Festival submissions, SXSW Music Festival Showcasing Artist applications, Interactive Innovation Awards, SXSW Accelerator Pitch Event, David Carr Prize, and the SXSW Art Program. Learn how to participate in one of the many prestigious SXSW categories below.
Applications Opening on Monday, June 26
PanelPicker
PanelPicker is the official SXSW user-generated session submission platform. This easy, two-step online process allows the SXSW community to have a voice in what creative and thought-provoking programming is scheduled at the SXSW Conference, SXSWedu, and SXSW Gaming. Upload proposals related to music, film, and digital technologies in variety of formats including panels, solo presentations, workshops, and more to help shape the 2018 SXSW programming.
Entry Deadline: Friday, July 21, 2017
Film Submissions
The SXSW Film Festival celebrates raw innovation and emerging talent from both behind and in front of the camera. Featuring provocative documentaries, comedies, genre standouts, and more, the festival has become known for the high caliber and diversity of films presented, and for its smart, enthusiastic audiences. Film submission categories include Feature Films, Short Film, Virtual Cinema, Texas High School Short Films, Title Sequences, and Music Videos.
Early Entry Deadline: Friday, August 25, 2017.
Showcasing Artist Applications
SXSW Showcasing Artists benefit from career changing exposure and publicity provided by the amazing mix of influential participants who attend SXSW every year. Showcasing at SXSW means performing in one of the many venues located in famous downtown Austin for industry reps, media members, and thousands of fans and fellow musicians from all over the world.
Early Entry Deadline: Friday, September 8, 2017
Interactive Innovation Awards
The Interactive Innovation Awards celebrate and honor the most exciting tech developments in the connected world. Innovators from across the digital industry have the opportunity to enter their exciting, new work in this competition – open to all projects, products, and developments launched or made in calendar year of 2017.
Early Entry Deadline: Friday, September 22, 2017
SXSW Accelerator Pitch Event
The SXSW Accelerator Pitch Event showcases the most ambitious startup talents from around the world with the most creative, new ideas to change it. Startups, companies, and tech innovators alike can enter their product or service for the chance to pitch to a live audience and panel of expert judges in March. Entry Deadline: Friday, November 10, 2017
David Carr Prize
Longtime New York Times writer David Carr spoke on numerous panels at SXSW throughout his career. After his passing in 2015, the David Carr Prize was launched to spotlight the intersection of technology and journalism. All emerging (and established) writers, bloggers, and journalists are invited each year to honor David Carr by entering an essay or short story in this competition.
Entry Deadline: Friday, October 13, 2017
SXSW Art Program
From established artists to emerging talents, the SXSW Art Program aims to assemble a diverse group of creatives to lend their unique contributions to Austin’s thriving art scene with permanent and temporary installations. Gain international exposure and connect with leaders in the fields of music, film, and technology by showcasing your innovative project in March.
Early Entry Deadline: Friday, August 11, 2017
Coming Soon: 2018 Registration and More Applications
Stay tuned for more 2018 application information coming soon for SXSW Release It, Gaming Awards, SXSW Community Grant, and SXSW Community Service Awards. Explore the 2017 Awards categories to view the 2017 winners and learn more about each program.
2018 registration and housing information is also on its way. Until then, take a trip down memory lane and get ready to help us write the next chapter of the SXSW Conference & Festivals during March 9-18, 2018.
Follow us on Twitter, Facebook, Instagram, and SXSW News for the latest announcements, recaps, and more.
Photo by Matt Winkelmeyer/Getty Images
Related News:
- Learn More About the 2018 PanelPicker
- SXSW Joins Mercedes-Benz to Host Future-Focused Convention in Frankfurt
- Sign Up for SXSW Event Updates
- Watch 2017 Keynotes, Red Carpets, and Showcases on the SXSW YouTube Channel
The post Apply to Participate on June 26: PanelPicker, Film Submissions, Music Showcases, and More appeared first on SXSW.
Source: SxSW Film
June 13, 2017
WHY THE WORLD NEEDS DATA-BASED STORIES MORE THAN EVER
This article originally appeared on Column Five.
There has never been a more confusing, more incendiary time in the media than this moment. Fake news, pundits, think pieces, op eds, blogs, Twitter feeds, and a trillion other platforms are disseminating information, yet opinion is reigning supreme over facts. Many of us have become disillusioned, retreating to our corners and shaking our heads. We are in the middle of a credibility crisis, and that’s why data-based stories are needed more than ever—especially for marketers.
Many groups, particularly millennials, are suspicious of brands’ intentions. The 2014 Edelman Brandshare survey found that 70% of consumers think brands only share information with them to increase profits.

So how can brands fight this sentiment? How can they break through that barrier of skepticism to deliver credible and valuable information? Data can help.
WHY WE NEED DATA-BASED STORIES
Too much marketing is one-sided. It serves the brand, not the audience. The whole reason we create content is to communicate and cultivate genuine relationships with people. But to foster true connection, that stuff we put out needs to be relevant, interesting, and worthwhile. Above all, it needs to be credible.
When it comes to the relationship between a brand and audience, credibility is everything. It’s not enough to have a great product or a solid service offering. People want to trust the people behind these products and services.
Readers are looking to you to guide them to the right decisions about your product or service. They want to know that you have their back and best interest at heart. They want to know you’re genuinely invested in helping them. They want and need to trust you.
Data-based stories are uniquely positioned to help you foster that trust. A strong data set reveals truths in cold, hard numbers. Dig into data and you uncover stories in the form of trends, correlations, outliers, and more. These stories may provide a big-picture view or hone in on a specific subject, but the insights extracted have very real-world consequences. Data storytelling can influence your audience’s behavior, expand their knowledge, and shift perspective in powerful ways.
By crafting a strong narrative anchored by solid data, you are creating content of substance. Whether a simple infographic or a large interactive, data-based storytelling gives you something to hang your hat on.
THE ELEMENTS OF TRUST
Again, in the current climate, where feelings and facts are blurred beyond recognition, data is a port in the storm.
Data provides evidence: If you can show your audience the data, not just “tell” them what you think, they will be far more likely to listen to you. When you are trying to deliver a certain message or takeaway, a story backed up by concrete evidence is much easier to trust.
Data storytelling provides transparency: The very act of transparency—showing them the data, especially if it’s internal—also demonstrates that you are vulnerable and willing to let them into your world. This is a great gesture of mutual trust.
DATA-BASED STORIES AND YOUR ORGANIZATION
Beyond the benefit to your audience, data storytelling also cultivates trust within your own organization.
It builds your credibility: You have a larger audience than you realize. Beyond customers or fans, you have colleagues, competitors, potential employees, industry contacts, and many more paying attention to the content you create. The more you demonstrate your interest and expertise, the more it will help your reputation in larger spheres.
It builds confidence: The better you can extract and communicate insights, the better you can make decisions. This builds confidence throughout your organization—confidence that your decisions and actions are informed by real-world data, which is important for your bottom line and company morale. Data provides an anchor for your team to gather around, so there are fewer arguments based on feelings or ego and more constructive discussions centered around data.
HOW TO DIVE INTO DATA STORIES
Telling great data stories just takes a little practice. If you don’t know where to start or you need a little refresher, here are a few things that might help.
- Look at these 9 sources to find great data for your next piece of content.
- Learn how to craft an effective narrative.
- Design your data according to best practices.
Source: Visual News
June 13, 2017
How to make effective infographics that tell a story?
Infographics have become one of the fastest growing tactics savvy visual marketers use today. In fact, the effectiveness rating for infographics rose more in one year than any other tactic—from 50 percent to 58 percent, according to the 2016 study by the Content Marketing Institute.
What’s in an Infographic?
We hear about infographics all the time in the digital marketing world, but unfortunately, many people are using the word incorrectly.
“An infographic is not a chart or a collection of graphs – it tells a story in a visual manner that makes difficult topics easier to digest for readers.”
-Brian Wallace
This particular type of visual storytelling can have a lot of benefits for brands in marketing campaigns by giving consumers content they want and building relationships instead of hard-selling.
There are several kinds of infographics:
 Click to view entire infographic
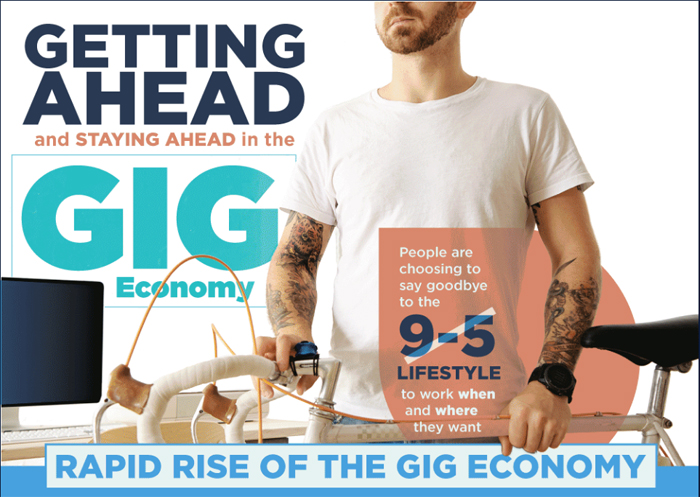
1) Static infographics that start with an idea and then uses visuals and snippets of text to tell a story. A good example of that is the above infographic about the gig or freelance, economy which starts by talking about the growth in freelancing and ends with tips for freelancers to help them do well.
 Click to view entire infographic
2) Interactive infographics like this one which explains where coffee comes from through a series of moving pictures and text that lead you through the process as you scroll down. It’s a fun way to get people interested in a topic, and content like this tends to get your company a lot of attention.
How to effectively distribute your infographics
![Cannabis as Medicine [INFOGRAPHIC]](http://www.visualstorytell.com/wp-content/uploads/2017/06/infographic3.jpg) Click to view entire infographic
Click to view entire infographic
Infographics tend to get shared a lot, not just on social media, but also through news stories relating to the topic. We recently had the above infographic get shared on over 100 different websites! When you create a high-quality, well-researched infographic you can share it with reporters as a news source that they can then use as a springboard for or complement to their next article on the topic.
To get started, follow these 3 tips
- Value-first: You have to be careful here, however- creating an infographic that doesn’t contribute value to the conversation is likely to fall flat.
- Make it useful to them: Focus instead on giving people something they can use instead of talking about your company’s latest whitepaper.
- Avoid talking about your company: The objective is to get more eyes on your company, and the best way to make sure that doesn’t happen is to only talk about your company.
Want to Know More?
I’ll be talking about infographics and the marketing strategies surrounding them on a FREE live video on June 29th at 10:30 AM EST. Be sure to register – I’ll be chatting about the power of infographic marketing leveraging narrative visuals and you’re going to want to hear this.
Source: Visual Storytelling
June 11, 2017
‘Wonder Woman’ Rules — and While Tom Cruise is Not a Flop, He’s No Longer in Control
“Wonder Woman” (Warner Bros.) built on its strong opening with a better than average second-weekend hold. The Patty Jenkins-directed D.C. Comic world entry is looking at strong foreign results, but it’s the domestic take where the response is strongest.
The same can’t be said for Universal’s attempt at a new series of classic monster character movies. “The Mummy” with Tom Cruise at the lead reinforced the big story for many top studio releases this summer so far. Foreign is strong initially, but domestic is weak even by relatively modest estimates.
In an otherwise unexceptional weekend, two wide releases — “It Comes At Night” (A24) and “Megan Leavey” (Bleecker Street) — from distributors usually associated with the specialized market placed in the top 10. Neither was stellar, but added about $10 million to the total. At this point, the boost is needed.
The Top 10
1. Wonder Woman (Warner Bros.) Week 2 – Last weekend #1
$57,180,000 (-45%) in 4,165 theaters (no change); PTA (per theater average): $13,729; Cumulative: $205,203,000
2. The Mummy (Universal) NEW – Cinemascore: B-; Metacritic: 34; Est. budget: $125 million
$32,246,000 in 4,035 theaters; PTA: $7,992; Cumulative: $32,246,000
3. Captain Underpants: The First Epic Movie (20th Century Fox) Week 2 – Last weekend #2
$12,300,000 (-48%) in 3,529 theaters (+95); PTA: $3,485; Cumulative: $44,563,000
4. Pirates of the Caribbean: Dead Men Tell No Tales (Disney) Week 3 – Last weekend #3
$10,713,000 (-51%) in 3,679 theaters (-597); PTA: $2,91213; Cumulative: $35,839,000
5. Guardians of the Galaxy Vol. 2 (Disney) Week 6 – Last weekend #4
$6,242,000 (-37%) in 2,911 theaters (-596); PTA: $2,144; Cumulative: $366,361,000
6. It Came at Night (A24) NEW – Cinemascore: D; Metacritic: 79; Est. budget: $5 million
$6,001,000 in 2,533 theaters; PTA: $2,369; Cumulative: $6,001,000
7. Baywatch (Paramount) Week 3 – Last weekend #5
$4,600,000 (-48%) in 2,832 theaters (-815); PTA: $1,624; Cumulative: $51,065,000
8. Megan Leavey (Bleecker Street) NEW – Cinemascore: A; Metacritic: 66
$3,768,000 in 1,956 theaters; PTA: $1,926; Cumulative: $3,768,000
9. Alien: Covenant (20th Century Fox) Week 4 – Last weekend #6
$1,800,000 (-56%) in 1,814 theaters (-846); PTA: $992; Cumulative: $71,212,000
10. Everything, Everything (Warner Bros.) Week 4 – Last weekend #7
$1,620,000 (-51%) in 1,546 theaters (-846); PTA: $1,048; Cumulative: $31,732,000

“The Mummy”
Universal Pictures
The Takeaways
Treading Water Again
The Top 10 estimate comes in at $137 million, down slightly from last year’s $140 million total. That figure came with three separate titles topping $20 million — “The Conjuring 2” ($40 million), “Warcraft” ($24 million) and “Now You See Me 2” ($22 million).
This year had “Wonder Woman” to the rescue to keep things close to even. Without it, the domestic report would be far grimmer.
“Cars 3” (Disney) should dominate next weekend with a potential $100 million, but it will fall far short of “Finding Dory” last year, a week that also featured the strong opening of “Central Intelligence.”
Is “The Mummy” Really a Flop?
At $32 million, “The Mummy” is second to “Oblivion” as Tom Cruise’s second best opener since “War of the Worlds” in 2005 (out of eight total, adjusted, and bracketing “M:I” titles). So it’s nothing like a career low.
But it’s still a concern. Universal counted on his presence to launch their new Dark Universe franchise of updates of classic monsters. It was an unusual attachment for the usually standalone film star, with a sense that it wasn’t shaped by him, for him (as most of his films, for better or worse).
The relatively weak performance came more from a combination of poor reviews and a concept that wasn’t really aimed at domestic audiences.
By any normal pattern, this won’t reach the $100 million level regularly achieved by Cruise’s films for third of a century. And that would normally be terrible news for a film with an admitted budget of $125 million (and rumored to be considerably higher).
That said: It could still be a success. It also opened in most of the world to a very good $142 million. That makes the domestic total less than one fifth of the initial results, and possibly as low of 15 percent of the eventual total if the film reaches $600 million. That’s based on a projection of $90 million at home and over $500 million overseas— perhaps at the high end, but not beyond reach. If the reported budget is correct, it will need to make more than $500 million worldwide to take it out of the red.
But here’s how poor the domestic result is. The earlier Mummy reboot contained four titles. Here are their adjusted opening weekends: “The Mummy”/$75 million, “The Mummy Returns”/$106 million, “The Scorpion King”/$55 million, “The Mummy: Tomb of the Dragon Emperor”/$50 million. That’s with Brendan Fraser in the lead for three, and then up-and-coming Dwayne Johnson for “Scorpion.” That’s what led to Universal committing major budgets to the proposed multi-monster series.
It’s just one time out, and they have a range of characters. But expect some reworking of the formula as they continue.

“Wonder Woman”
The Women Are Wonders Again
Here’s the standout fact about the second weekend of Patty Jenkins’ breakout success. Its drop of 45 percent puts it ahead of the same week drop of recent comic book character non-sequels like the first “Guardians of the Galaxy,” “Deadpool,” “Suicide Squad,” and “Doctor Strange.”
Attribute that to strong positive initial response (seen already with a surging Sunday last week) and perhaps deeper fanboy acceptance to what might have been some residual resistance to a female action lead. The 10-day total is already $205 million, with $300 million or more now likely (if it hits $303 million, it would be the biggest female-directed live-action hit ever, beating out Amy Heckerling’s male-lead “Look Who’s Talking” in adjusted gross)
Foreign, “Wonder Woman” has grossed $230 million total so far, with Germany and Spain next weekend (strong territories) and Japan at the end of August. But the difference in overseas performance between “Wonder Woman” and “The Mummy” is striking, suggesting why it won’t single-handedly overcome resistance to female-centered action titles.

“Pirates of the Caribbean: Dead Men Tell No Tales”
Holdovers
“Pirates of the Caribbean: Dead Men Tell No Tales” is up to $528 million worldwide, so its 51 percent third weekend domestic drop is of less concern for Disney. Still, it is falling below the levels that took the 2011 entry to $1.1 billion worldwide (though the still-to-come Japan will help). With a $230 million budget it’s still likely to pay off, but spending as much for more titles will take some careful consideration.
DreamWorks Animation’s “Captain Underpants” fell 48 percent, on par for animated films in their second weekend. It faces “Cars 3” next, but as a lower-budget title and $44 million so far, it feels like a decent gap-filler.
“Guardians of the Galaxy Vol. 2” is stellar, with only a 37 percent drop in its third weekend. Now up to $366 million, it gives “Wonder Woman” a high-water mark to reach in domestic results.
Source: IndieWire film
June 11, 2017
Chi Po-lin, Director of ‘Beyond Beauty: Taiwan from Above,’ Dies at 52
Just days after announcing a sequel to his film “Beyond Beauty: Taiwan from Above,” Chi Po-lin died in a helicopter crash yesterday. The Taiwanese director was 52. Pilot Chang Chih-kuang and his assistant Chen Kuan-chi were also killed in the accident, which took place near the town of Fengbin just before noon local time. There were no survivors.
READ MORE: Ben Affleck Pays Tribute to Adam West: ‘Thank You for Showing Us All How It’s Done’
“Director Chi’s works have allowed us to see the beauty of Taiwan, and inspired others to join the efforts to conserve our land. His passing is a tremendous loss to Taiwan,” said Taiwanese president Tsai Ing-wen on social media. Chi had previously served as an aerial photographer for Taiwan’s Ministry of Transportation.
READ MORE: Adam West, TV’s Original Batman, Dies at 88
Born December 27, 1964 in Taipei, Chi won the award for Best Documentary at the 2013 Golden Horse Awards for “Beyond Beauty”; he also directed the short films “Taiwan from the Air” and “Taichung: The Heart of Taiwan.” “Beyond Beauty II” was scheduled for release in 2019 and Chi is said to have been shooting footage for it when the accident occurred.
Stay on top of the latest breaking film and TV news! Sign up for our Email Newsletters here.
Source: IndieWire film
June 11, 2017
A Tweetstorm Reveals the Nuances in the ‘Star Wars’ Prequels You Never Noticed
The “Star Wars” prequels aren’t especially well regarded, but the healing has begun. The success of “The Force Awakens” and “Rogue One” appears to have softened public perception of Episodes I–III, and blogger Glendon Mellow took to Twitter to reveal a number of nuances that most of us never picked up on while complaining about Jar Jar.
READ MORE: Memes Are Helping People Learn to Love the ‘Star Wars’ Prequels
For instance, were you aware of the connection between the music at the end of “Phantom Menace” and the Emperor’s theme from “Return of the Jedi”? Or the fact that “the elegance of the Old Republic is communicated mainly through architecture, Naboo-human and Gungan. Also with ring cities on Coruscant”? Mellow also went into detail on the prequels’ colonialism subtext, which he says was never fully developed — and might be the most interesting part of his tweet storm.
READ MORE: ‘Kylo’ Became One of the Most Popular Baby Names Last Year, Thanks to ‘Star Wars’
He even made a case for Anakin: “My wife once said to me, maybe his dialogue is cringey because he has zero models of how to speak romantically to someone. He’s a teen monk. His whole relationship with Padme is like an overeager 12 year old on a first date. And Padme seems to understand this. He’s straightfoward.”
Read more here, including Mellow’s thoughts on why it made sense for the clones to immediately execute Order 66.
All right, it’s time.
1 Like = 1 cool thing about the Star Wars prequels.
Let’s go. pic.twitter.com/LZhFZZUz2Y— Glendon Mellow (@FlyingTrilobite) June 6, 2017
Stay on top of the latest breaking film and TV news! Sign up for our Email Newsletters here.
Source: IndieWire film
June 11, 2017
‘Beatriz at Dinner’ Pulls Specialty Crowds as ‘My Cousin Rachel’ Struggles
Fox Searchlight pushed Rachel Weisz melodrama “My Cousin Rachel” into national release this prime summer weekend, which boasts only one new wide studio opening. But the romantic mystery thriller failed to click with audiences.
On the other hand, Roadside Attractions kept Miguel Arteta’s Sundance hit “Beatriz at Dinner” in limited dates, where the edgy and compelling story of a mismatched dinner at a Southern California estate thrived in its first limited run. With a $30,000+ per theater average and a potential appeal beyond core art house audiences, this Salma Hayek starrer could make a significant impact in upcoming weeks.
Eleanor Coppola’s romance “Paris Can Wait” continues to lead wider releases, at a decent level for its theater break but significantly below such top 2016 crossover performers as “Love and Friendship” and “The Lobster” at this time.

Opening
My Cousin Rachel (Fox Searchlight) – Metacritic: 63
$954,000 in 523 theaters; PTA (per theater average): $1,824
Until recently this sort of specialized drama scored well in a conventional platform release with a calibrated expansion soon after. But Fox Searchlight chose a national multi-hundred initial break for this remake of this Daphne Du Maurier Gothic mystery (which gave Richard Burton his first Oscar nomination). Despite Weisz leading the cast, this did modest business. By comparison, a few weeks ago “Gifted” in about a tenth as many theaters did almost half the business of “My Cousin Rachel.” In a scattered weekend, the movie ranked #11 overall, and showed a normal adult-audience second-day increase of 48 per cent. But it will need a strong hold next weekend if it is to have any chance of sustaining more than a short run.
What comes next: It’s already close to as wide as many similar films unless good word of mouth justifies more an even broader expansion.
Beatriz at Dinner (Roadside Attractions) – Metacritic: 68; Festivals include: Sundance 2017
$150,160 in 5 theaters; PTA: $30,036
Miguel Arteta’s dark comedy pitting Salma Hayek vs. John Lithgow nabbed the strongest limited opening in recent weeks and one of the top of the year, with Los Angeles in particular responding to this story of an awkward encounter of a Mexican emigre and a group of wealthy people with whom she spends a troubled evening. With a compelling vibe similar to “Get Out,” “Beatriz” struck an initial chord. In upcoming weeks, this heady movie could combine arthouse audiences with Latino moviegoers.
What comes next: This expands to 70 theaters this Friday with a wider release right after.

The Hero (The Orchard) – Metacritic: 59; Festivals include: Sundance, Seattle 2017
$48,414 in 4 theaters; PTA: $12,104
Sam Elliott is getting strong reviews for his lead role as an aging Western star confronting multiple significant events in his life in quick succession. Its initial New York/Los Angeles results suggest some interest to give it a chance to find an audience, but it will take continued support and good word of mouth.
What comes next: The expands quickly to 30 theaters this Friday, with a projected 450 by the end of the month.
Night School (Oscilloscope) – Metacritic: 75; Festivals include: Tribeca 2016
$1,600 in theaters; PTA: $1,600
Getting a qualifying initial release in New York, this documentary about a group of older students struggling to achieve their educational goals in Indianapolis did modest business with limited shows at the IFC Center.
What comes next: Further big city openings are planned for this month.

“Churchill”
Week Two
Churchill (Cohen)
$200,918 in 187 theaters (-28); PTA: $1,074; Cumulative: $798,083
Brian Cox as the British leader on the cusp of D-Day continues to find very little interest in what looks to be a short run.
3 Idiotas (Lionsgate)
$250,000 in 349 theaters (no change); PTA: $716; Cumulative: $1,061,000
A rare failure from Lionsgate’s Spanish language partner Pantelion. This comedy has much lower than usual numbers among their targeted releases.
Dean (CBS)
$40,000 in 32 theaters (+17); PTA: $1,250; Cumulative: $121,123
Demetri Martin’s comedy (in which he costars with Kevin Kline as they deal with life after the death of their mother and wife respectively) expanded but continued its lukewarm response from its initial week.

“Band Aid”
Band Aid (IFC) (also available on Video on Demand)
$30,252 in 12 theaters (+9); PTA: $2,571; Cumulative: $70,636
Though it debuted on VOD, this LA couple working out their issues through making music comedy added new theaters with adequate results.
I, Daniel Blake (IFC)
$(est.) 52,000 in 41 theaters (+29); PTA: $(est.) 1,200; Cumulative: $(est.) 130,000
Ken Loach’s 2016 top prize winner at Cannes continues to get little domestic traction despite strong reviews.

“Paris Can Wait.”
Roger Arpajou
Ongoing/expanding (grosses over $50,000 in under 1,000 theaters)
Paris Can Wait (Sony Pictures Classics) Week 5
$457,207 in 176 theaters (+25); Cumulative: $2,293,000
Eleanor Coppola’s escapist French road trip continues to stand out among specialized recent releases with a continued decent response as it slowly expands. Expect this to more than double this gross as it goes wider.
Norman: The Moderate Rise and Tragic Fall of a New York Fixer (Sony Pictures Classics) Week 9
$114,161 in 160 theaters (-72); Cumulative: $3,661,000
Richard Gere as a financial in-between ended up with mostly specialized response but a decent number.
The Wedding Plan (Roadside Attractions) Week 5
$106,700 in 105 theaters (-18); Cumulative: $1,181,000
This rare subtitled release for Roadside (from Israel) has become one of the few to pass the $1 million total this year among specialized market releases.
Gifted (Fox Searchlight) Week 10
$100,000 in 162 theaters (-63); Cumulative: $24,272,000
The season’s biggest initially limited release crossed over well and still could hit $25 million.
The Zookeeper’s Wife (Focus) Week 11
$63,745 in 92 theaters (-23); Cumulative: $17,400,000
The longest-running film still getting attention, this has been a significant success for Focus.
The Lovers (A24) Week 6
$(est.) 63,000 in 127 theaters (-221); Cumulative: $(est.) 2,103,000
Debra Winger’s comeback role in a marital comedy/drama is finishing up its modestly successful run.
A Quiet Passion (Music Box) Week 9 98-1680
$ 50 in 65 theaters (-33); Cumulative: $
Late-run returns for Terence Davies’ latest period drama could bring this close to $2 million.
Also noted:
The Women’s Balcony (Menemsha) – $43,248 in 14 theaters; Cumulative: $390,905
The Lost City of Z (Bleecker Street) – $27,515 in 50 theaters; Cumulative: $8,424,000
Wakefield (IFC) – $21,300 in 30 theaters; Cumulative: $195,832
Restless Creature: Wendy Whelan (Abramorama) – $14,982 in 6 theaters; Cumulative: $83,602
Source: IndieWire film