-
The Rise And Fall Of Food Trends Over The Years
March 3, 2017
March 3, 2017
The Rise And Fall Of Food Trends Over The Years
Like anything else, food trends and diet fads change as often as the seasons. If you’re curious about what recipes or regional cuisines are in, the best way to do it is to look at Google search analytics.
A collaboration between Google News Lab and Truth & Beauty, The Rhythm of Food explores how our interests in food have changed over the years:
“[W]e explore the hidden patterns in Google search trend data. This project sheds light on the many facets of food seasonality, as seen through the lens of search interest in the United States over the last twelve years.”
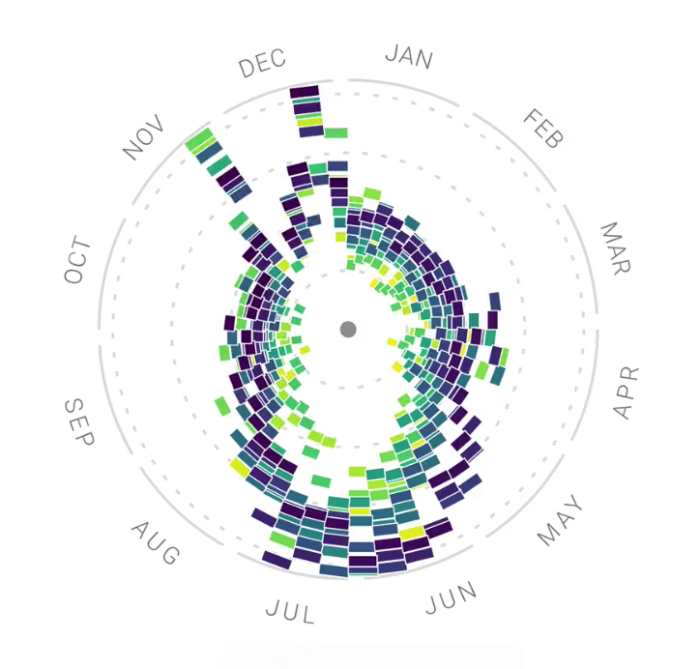
The Rhythm of Food looks at Google search data between 2004 and 2016 to determine just how trends and cuisine interests have developed and shifted. By analyzing the search patterns of ingredients and specific dishes and plotting them on a year clock, the study reveals how the seasons affect the rhythm of food.

The interactive lets users determine what food trends, ingredients, or recipes were searched for the most in a given month over the 12 year period compared to the other months. Each color represents a different year on the year clock and scrolling over each block reveals a Google Trends score and the week in which the data was pulled from. In-depth information is also provided for each search term, giving users a better understanding of the year over year trends.
The analysis shows very clear patterns of food searches based on the natural seasons, holidays, and special events. Another level of investigation compares how often certain foods are searched in a given country. With it, users can compare how often food items, such as “kale,” are searched for in Germany versus Japan.

The interface of the interactive itself is easy to navigate and provides a variety of categories and food items to choose from. The site currently includes 201 topics and displays 135,025 individual data points. All of the information gathered was obtained from Google Trends, with a focus on data from the United States, and search terms correctly determined using Google Knowledge Graph topics.
You can explore various food trends for yourself here.
Source: Visual News
0 Comments
Leave A Comment