June 26, 2017
9 DATA SOURCES TO INSPIRE YOUR NEXT PIECE OF CONTENT
This article originally appeared on Column Five.
Data storytelling is one of the best ways to create unique, original, and credible content marketing, but you need some solid data sources to start.
Good marketers are well-suited to extract and communicate great data stories because they know who they’re talking to, what interests them, what their pain points are, and how to speak to them. (That’s where data scientists often struggle.) So there’s no reason not to dive into data—unless you don’t know where to look. here is plenty of data all around, both in your company and on the online.
THE BEST DATA SOURCES TO START
There is plenty of data all around, both in your company and on the online. Here are 9 great data sources to help you uncover your next great data story.
1) SURVEYS
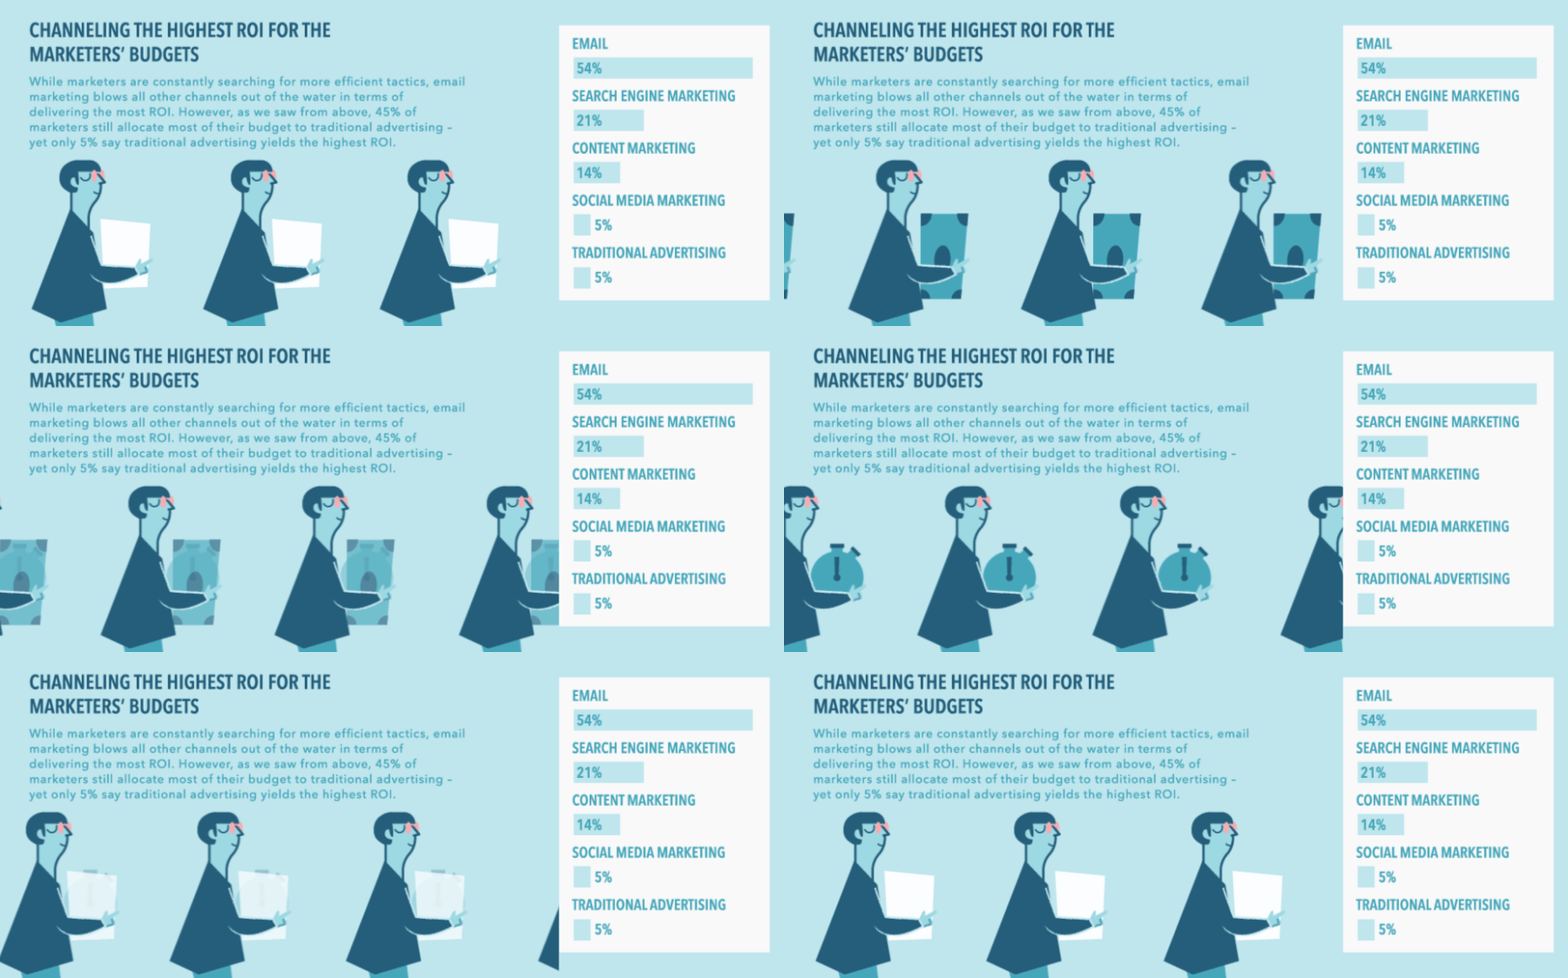
Surveys are one of our favorite data sources because they let you tap right into the thoughts and feelings of specific groups. They can be short or lengthy, surveys can always provide great fodder for stories whether they come from your own company or an industry survey.
Example: We helped Newscred visualize the results of a content marketing survey in an animated infographic.

2) CUSTOMER DATA
This information has long been used to help companies create a better experience for their customers, but it can provide valuable insights into your customers’ wants, needs, or knowledge gaps—and help you identify how your content can address those issues.
An added bonus: This information helps you build stronger audience personas (psychographic maps of different audience segments), which you can use to vet any and all content marketing ideas going forward.
Example: To celebrate Number26’s first year in business, we created an infographic to show their success, using insights from customer data.

3) COMPANY INITIATIVES
Data storytelling offers a chance to shed light on many different aspects of your company. Even better, all of that data is right in your hands. Think of ways that information might be used to educate people about what you do or who you are.
Example: We partnered up with The World Bank to create an interactive data visualization that allows users to explore the different ways the company is funding new educational initiatives worldwide.

4) ANALYTICS
You have access to a ton of info, from how many visitors your website has to how your efforts are performing. There are plenty of great stories in this data. When you know what people respond most to, you can determine what stories they’d be most interested in. Sometimes even your own marketing efforts can become the story.
Example: We published an article that told the story of how we revamped our marketing strategy and increased our leads 78% in only 6 months. We shared the data and offered tips to help others improve their own strategy, too.
5) COMPANY REPORTS
Reports, white papers, and case studies all contain valuable information that can easily be turned into data storytelling. Even better, the data contained in these reports can be published on social as microcontent, helping to further promote the original piece of content.
Example: We helped HighFive turn insights from their “Workplace Culture and Communication” report into an engaging infographic.

6) INDUSTRY STUDIES
Not every company has the resources to commission large studies, but that doesn’t mean you can’t find an original angle in other people’s data. (In fact, studies from larger entities may get you access to data you wouldn’t otherwise have.) Look for ways to pull interesting insights out of these studies and turn them into useful content.
Example: We turned data from the Global Entrepreneurship Monitor Report into an interesting infographic about the ages that entrepreneurs are most likely to pursue their business. For Clarity, a company that connects startup entrepreneurs with business experts, it was a perfect subject.

7) ANNUAL REPORTS
Beyond the standard legal requirements and financial disclosures, annual reports include a wealth of interesting data. Creative data storytelling can really bring this info to life as infographics, interactive infographics, motion graphics, and more.
Example: We turned the Krochet Kids intl. 2013 annual report into an interactive experience to let visitors explore the data and the company’s mission.

For more annual report inspiration, check out 40 examples of incredible annual report design.
8) EMPLOYEE DATA
Your coworkers and company culture can also make for interesting or entertaining data storytelling. This is especially great fodder for social media, where you can really show off your brand personality.
Example: As data geeks and lovers of our Beer Friday tradition, we tracked a day’s worth of company liquid consumption and turned it into a fun little infographic.

9) PUBLIC SOURCES
The Web is full of interesting data sets from reliable sources, such as government agencies, educational institutions, and non-profits. You can mine these to uncover data stories or use them to supplement stories you already have. To start, check out our roundup of 104 free data sources.
Example: For Earth Week, NBC Universal used data from the Natural Resources Defense Council to create a video encouraging Americans to reduce food waste.
LEARN TO TELL BETTER DATA STORIES
No matter what data story you’re telling, the key is to make sure your story is credible, interesting, and delivered effectively. To help you do that:
- Learn more about why content marketers need data storytelling.
- Check out our 5 tips for sourcing data.
- Find out how to craft an effective data narrative.
- Follow best practices to design effective charts and graphs.
- Try Visage, our easy data design platform.
Source: Visual News

0 Comments
Leave A Comment