-
News & Updates
careering
February 26, 2017
If ‘The Salesman’ Wins the Oscar, These Two Iranian-American Heroes Will Accept the Award
Asghar Farhadi’s “The Salesman” is considered by many to be the frontrunner for the Academy Award for Best Foreign-Language Film, but the writer/director won’t be attending tonight’s ceremony. Farhadi — who previously won the prize for “A Separation” — has chosen to boycott the Oscars due to Donald Trump’s Muslim ban, which has since suffered several defeats in court. Going in the filmmaker’s stead are two Iranian-Americans: Anousheh Ansari and Firouz Naderi.
READ MORE: ‘The Salesman’ Director Asghar Farhadi Won’t Attend Oscars, Citing Muslim Ban
Ansari, who moved to the United States in 1984, is a space tourist with the distinction of being the first Iranian in space, the first Muslim in space and the first self-funded female explorer to make her way to the International Space Station; Naderi worked at NASA for more than three decades, including stints as director of Solar System Exploration and overseer of the Mars Exploration Program.
READ MORE: ‘The Salesman’: Will Academy Members Give it an Oscar To Protest Trump?
“I believe that the similarities among the human beings on this earth and its various lands, and among its cultures and its faiths, far outweigh their differences,” wrote Farhadi in a statement announcing his plan not to attend the Academy Awards. “I believe that the root cause of many of the hostilities among nations in the world today must be searched for in their reciprocal humiliation carried out in its past and no doubt the current humiliation of other nations are the seeds of tomorrow’s hostilities. To humiliate one nation with the pretext of guarding the security of another is not a new phenomenon in history and has always laid the groundwork for the creation of future divide and enmity.”
Stay on top of the latest breaking film and TV news! Sign up for our Email Newsletters here.
Source: IndieWire film
February 26, 2017
LG G6 ditches modularity in favor of essentials
LG’s handful of recent teasers for its new G6 flagship left us wondering if there’d be any surprises left for us at its launch event today. Back in early January, the company was rather frank about moving away from the G5’s modular design due to a lack of interest, followed by a promise of …
Source: CW’s Flipboard Feed
February 24, 2017
These Maps Put A Spotlight On The Cultural Divide In The U.S.
It has been several months since the election and thanks to a series of post-election maps, we can clearly see which area of the United States voted for Donald Trump or Hillary Clinton. But let’s say you didn’t have those maps. Let’s say you had to determine which areas of the U.S. supported either candidate more. Would you be surprised to find out that the popularity of a TV show like ‘Duck Dynasty’ correlates to how strongly Trump did during the election?
Based on these maps released by The Upshot of The New York Times, there is a very close relation between politics and culture.
Using Facebook data to determine which TV shows were “liked” by users in various ZIP codes, they found that 50 of the most-liked shows were separated into three distinct groups based on geographic distributions. The data reveals a cultural divide among three regions in the U.S.: cities and suburbs, rural areas, and the extended Black Belt, an area extending from the Mississippi River along the Eastern Seaboard and up to Washington as well as locations with large nonwhite populations.
Urban Areas

Most common shows: Adventure Time, American Horror Story, Family Guy, Game of Thrones, It’s Always Sunny in Philadelphia, Modern Family, Mythbusters, Once Upon a Time, Orange is the New Black, Saturday Night Live, So You Think You Can Dance, South Park, The Big Bang Theory, The Daily Show, The Simpsons, The Tonight Show, Tosh.O
Rural Areas

Most common shows: 16 and Pregnant, American Dad!, America’s Funniest Home Videos, Bones, Cake Boss, Criminal Minds, Dancing With the Stars, Deadliest Catch, Duck Dynasty, Fast n’ Loud, Grey’s Anatomy, NCIS, Pawn Stars, Pretty Little Liars, Ridiculousness, Rob Dyrdek’s Fantasy Factory, Supernatural, Teen Mom, The Vampire Diaries, The Voice, The Walking Dead, Wipeout
Extended Black Belt

Most common shows: 106 & Park, Bad Girls Club, Empire, Keeping Up With the Kardashians, Law & Order: SVU, Love & Hip Hop, Real Housewives of Atlanta, Scandal, Spongebob SquarePants, The First 48, The Tom and Jerry Show
The 50 maps were ranked in order of the disparity between their highest and lowest fan percentages, and as you can see, there is a strong cultural divide throughout the U.S. Gone are the days when networks focused solely on audience numbers. Now it’s all about demographics which helps to fracture national culture.
Take a look at some of the maps below to see just how large the cultural divide is and make sure you check out the rest of the maps here.
1. Duck Dynasty

5. The Daily Show

7. Modern Family

9. Empire

11. The Big Bang Theory

15. Game of Thrones

16. The Walking Dead

17. Bad Girls Club

19. The Tonight Show

21. Fast n’ Loud

24. Deadliest Catch
25. Teen Mom

40. 16 and Pregnant

43. Cake Boss

45. Supernatural

50. The Vampire Diaries

[Via: The New York Times]
Source: Visual News
February 24, 2017
Video Editing Tips: Consider Slides, Pushes, and Splits in Premiere Pro
Growing tired of the same old default cross dissolve in Premiere Pro? Consider spicing up your splices with pushes, slides, and splits.<p><i>Cover Image</i> …
Source: CW’s Flipboard Feed
February 23, 2017
You Need To See These Beautiful Alternative Movie Posters
With the Oscars right around the corner, there’s a lot of anticipation to see who will take home the little, gold man. So many fantastic films have been nominated this year, it’s hard to choose just one in each category. To honor the many films being nominated this year, the illustrators over at DepositPhotos created a series of alternative movie posters for a few of their favorite movies.
Rather than speculate on the political, social, or artistic aspects of the nominations, the illustrators decided to focus their energy on the art to capture the essence of each film for their renditions. The movie posters were illustrated before the nominations were announced as a way to inspire contributors of their site and were based on their own predictions. Each of the movie posters was illustrated based on the artist’s particular style which makes the series charming and diverse.
Check out the 7 posters below:

Artist: Diana Hlevnjak

Artist: RINOMONSTA

Artist: Nadezhda Arkhipova

Artist: Anastasia Lembrik

Artist: Oksana Grivina

Artist: Jr Casas

Artist: Dina Lepchenkova
Source: Visual News
February 23, 2017
How to Rise above the Noise with Visual Storytelling
Since we’re talking about the power of visual storytelling, I figured it only makes sense to use a familiar visual format – the narrative photo strip – to vividly underscore the importance of solving the “noise” problem.

How do you define “advertising noise?“
It’s like the classic noise picture above, where every pixel is an ad that is transmitted at the same time with an average same velocity, content, and size. The result is zero salience that spurned a projected 24% increase in US ad blocking usage in 2017 (eMarketer) – a continued trend of double-digit YoY growth.

How was the noise created?
Ads are just a subset of the larger marketing noise that results in two opposing forces that mired the communication landscape today: 1) Increasing information overload and 2) audiences’ decreasing attention spans.

Too much information
5 exabytes (that’s 18 zeroes!) of online content are created each day (ACI). This content onslaught is driven by 3 drivers: 1) Global Internet adoption – almost 3 billion Internet users. 2) The emergence of social media and 3) The adoption of smart mobile devices for on-the-go production and consumption.

But, less attention
A marked and well-documented decrease in user attention span: The average human attention span is down to 8 seconds (Microsoft). That means the more ads people see, the more they actually ignore them (aka “ads blindness”).

This noise results in
More businesses at any stage are struggling to get their voices heard and break through the clutter in our overcrowded and fragmented attention economy.

How big is the noise gap?
Only 30 years ago, Americans saw only 2000 marketing messages a day. Today the number climbed to 5000 (Yankelovich)!

What are the implications for businesses?
Into this crowded, and short-attention span marketplace, 50% of small businesses fail in the first four years (Source: Bureau of Labor Statistics).

But why businesses fail?
The top reasons according to CBInsights: No Market Need (42%), Get Outcompeted (19%), Lack of Business Model (17%), Poor Marketing (14%) – all reasons that unequivocally indicate that most startups don’t know how to articulate, validate and distribute a coherent business story.
Making CMOs’ job harder than ever
4.1 years! CMOs have the lowest c-suite average tenure (Korn Ferry), as externally they need to navigate this noise, drive sales short-term, while building brand long-term. And internally they need to tame fragmented data coming from multiple channels, prove ROI while training the staff and instilling management/culture change.

Enter Visual Storytelling
Leveraging our rich corporate marketing experience with our passion for visual and narrative media, we formed the Visual Storytelling Institute. VSI offers a unique visual literacy platform that helps business leaders combine the power of storytelling with the effectiveness of visual media – in order to create profitable customer engagements.

Why visual?
We recognize that our brain is natively wired to process visuals.“Visuals are processed 60,000 times faster than text by the human brain and 90% of information transmitted to the brain is visual” (3M).

Why storytelling?
The human brain has a preference for information packaged as stories. In fact, “92% of consumers want brands to make their ads feel like stories.” (OneSpot)
So what is visual storytelling?
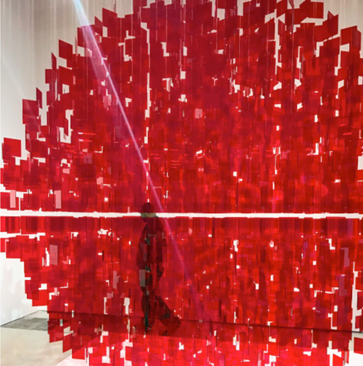
“Visual Storytelling is a marketing strategy that involves 3 conditions: 1) communicating ideas through the 3-act story arc 2) placing your customer at the heart of the story and 3) delivering your story through immersive visual media – in order to create profitable customer engagements.” -Shlomi Ron (artwork: Julio Le Parc)

How VS can help marketers rise above the noise?
After closely researching the space, we have developed a 9-step My Visual Story framework that helps business leaders articulate, visualize and distribute their business stories with meaningful, relatable and emotional narratives.
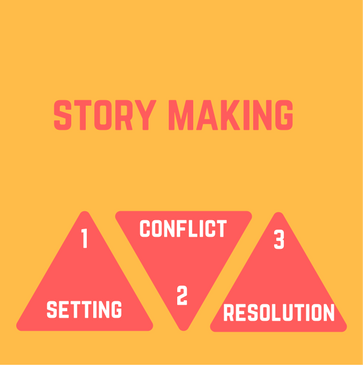
Phase 1: Story Making
We identify the business story based on: a) Setting: backstory and purpose, top buyer personas and goals; b) Conflict: buyers’ core challenges, emotional and meaning maps; and c) Resolution: Solution features, brand experience and advocacy mechanisms.
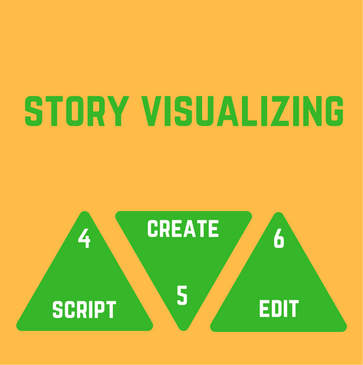
Phase 2: Story Visualizing
We transform the identified business story into a compelling video and other visual formats, following: a) Script: Leveraging resulting Business Narrative Statement, identify supporting stories, and script writing; b) Create Assets: Shoot a video explainer around target product; and c) Edit: Video editing and mastering.
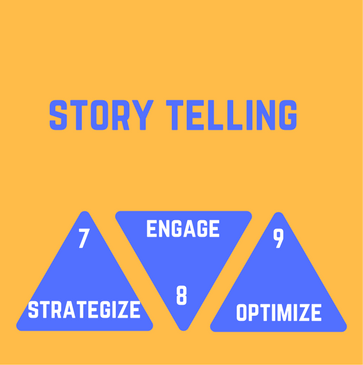
Phase 3: Story Telling
We train marketers how to distribute their visual stories across online and offline channels, following: a) Strategize: Setting marketing goals, audience, and content strategy;
b) Engage: Reviewing proactive, reactive engagement tactics and influencer relationship management; and c) Story Analytics: Measuring visual stories’ performance and optimization.

What’s the big message?
As you’ve seen it’s a noisy market out there. At the end of the day, nobody cares about your product! But they’ll love your BIG STORY solving your customer problem. Having a good product is a given, it’s up to you to identify your BIG STORY and become a salient STORY MAKER that in turn will transform your audience into revved-up STORY TELLERS on your behalf.
Need help optimizing your BIG STORY to rise above the noise?
Hey, we’re just a call away: Schedule a conversation
Source: Visual Storytelling
February 22, 2017
The Unedited StoryCorps Interview: Allegra Westbrooks & Shara Traynham
Did you know that the broadcast pieces you hear on NPR and our podcast are excerpts of longer conversations stored in the StoryCorps Archive? Participants are invited to visit one of our recording locations with a friend or family member to record a 40-minute interview with the help of a trained facilitator. Over the past 14 years, we’ve added nearly 70,000 interviews to the StoryCorps Archive.
In celebration of Black History Month, we’ve selected an unedited interview from StoryCorps Griot — an initiative ensuring that the voices, experiences, and life stories of people of African descent are preserved and presented with dignity. You’ll hear the voices of Allegra Westbrooks and her niece, Shara Traynham. The two women came to the StoryCorps MobileBooth in February 2008 when it visited Charlotte, North Carolina.

After graduating from Atlanta University’s School of Library Service, Westbrooks embarked upon her career as an educator and librarian. In 1947, she was hired as a librarian by the Charlotte Public Library system — a segregated institution at the time. The library director tasked Westbrooks with “preaching the gospel of books.” And that she did. Westbrooks launched a campaign aimed at local churches in hopes of increasing readership and library attendance. In this StoryCorps conversation, Westbrooks remembers the effects of segregation on the library as well as her lifelong passion for literature. Listen below, and access a full transcript here.
All StoryCorps Griot interviews are shared with the National Museum of African American History and Culture. To hear more unedited interviews from the StoryCorps Archive, make an appointment at the American Folklife Center at the Library of Congress.
All material within the StoryCorps collection is copyrighted by StoryCorps. StoryCorps encourages use of material on this site by educators and students without prior permission, provided appropriate credit is given. This interview has not been fact-checked, and may contain sensitive personal information about living persons.
Source: SNPR Story Corps
February 22, 2017
How To Create Engaging Motion Graphics In Four Steps
What are motion graphics? Simply put, they are animated graphics that tell a story. Motion graphic stories can be told through kinetic text, through animated images, or both. They can be 2D or 3D. There are so many options, which is why we love them.
If you’re not too familiar with motion graphics, here’s one of our parent company’s, Column Five, for reference.
Now that video is on the rise, motion graphics are a more popular medium than ever. They’re fantastic storytelling tools, but they are not all created equal. A truly compelling and effective motion graphic includes many important elements.
If you want to make a great end product, you need to nail each step along the way. C5 has been making motion graphics for almost a decade, and they’ve learned a lot along the way. To give you a crash course, they’ve broken down the four stages of motion graphic production and provided their tips along the way.
Step 1: Write a Solid Script
They can’t stress this enough. Motion graphics are short. Yours may be 30 seconds or a minute and a half. This means you only have a little time. While you might be tempted to cram in as much as possible, simplicity and clarity are key. Ask yourself these questions to help craft your story:
- Who am I trying to reach?
- What do I want them to learn? Remember? Do?
- How do I want to make them feel?
Remember: Motion gives you multiple ways to tell your story, and you don’t have to say the same thing with each.
Unlike static infographics where you rely on visuals and copy to tell your story, motion graphics give you movement, sound, and other tools. As you craft your script, consider which parts of your story may be best communicated through the following:
1) Kinetic (or onscreen) text: Text-only storytelling can be great for situations like trade shows where sound isn’t an option. This can also be a storytelling tool to make your audience focus, as people tend to pay attention when they have to read.
2) Voiceover: In marketing, we talk a lot about finding your brand’s voice. Voiceover is an opportunity to literally do that. VO accompanies on-screen animation, so the two work in tandem. But be wary of over-scripting. Having your voiceover artist read off your sales numbers from last year is a waste when that same information can be quickly and efficiently shown on screen with some animated data visualization.
3) Both: As mentioned before, voiceover and visualization combined work well for data visualizations, explainer videos, or any time you need to clarify or label something onscreen.
4) Visuals-only: While not as commonly used, you can still create a compelling graphic with no text. (Again, think tradeshows.)
Need a little more help for scriptwriting? Here’s how to write a motion graphic script that your team will love.
Step 2: Storyboard While you Brainstorm the Visual Treatment
The storyboard phase brings together the script and visuals, and helps you start to see the final product take shape.
C5’s storyboarding sessions begin with a brainstorm with members from their design and production team. This approach works well for them as it brings the scriptwriter (the producer) and the storyboard sketch artist (the designer) together.
During this stage, they tend to draw out frames on a whiteboard and review the final script together before they get started. Then they start sketching ideas to bring the script to life.

Step 3: Take the Storyboards into Design
As with any visual project you create, style and color communicate just as much as the story itself. Even when you’re working with your own brand guidelines, simple choices can greatly impact your audience.
Once C5 has an idea of the storyboard with sketches, they begin translating their storyboards into actual designs. Everything at this stage is used in the final animation stages, so they take the time to get the details right. Note: It helps if the person who is sketching the storyboards is also handling the design.
During this stage, they usually write out the visual notes, which are reviewed by their team and partners before they’re passed along to the animation team for use in the final cut.


Step 4: Animate the Final Designs
The animation phase is when everything comes together. Their process ensures that each step builds upon the next so that by the time they start animating, everyone has a really good idea of what’s to come. Animation and other elements introduced at this phase are as important as the script.
That said, it’s important to make sure everything at this stage is solid. Some things to think about:
- Animation style: This isn’t just about fading in and out of scenes; how you transition from one point to the next influences how cohesive the story is. Swiping away a scene communicates finality, whereas moving from point A to point B keeps the story moving. Remember: You don’t want to confuse or jar your audience.
- Timing: Pacing can make or break your motion graphic. Too rushed and people won’t “get” what you want to tell them. Too slow and you’ll lose your audience’s attention. Pace keeps people interested. Consider strategic variations to add excitement.
- Music: Like with all the other elements, music is another layer to drive your narrative. It can set the mood, fill gaps, and affect the tone of the story.
- Sound effects: This can be hit or miss depending on who you’re working with. Some animators believe that you should let the other elements speak for itself. Others think they’re a necessity. The key is to only use what adds value to your project and doesn’t distract from the story you’re trying to tell. (That goes for everything we’ve discussed here.)
If you do these things well, your end result might look something like this:
And that’s a wrap.
If you want to learn more about creating great motion graphics and videos, watch these 100 awesome motion graphics to get inspired and find out how to get the most views on your motion graphics.
Need a little help creating your motion graphics? Check their tips for how to choose a video agency and how to get awesome work from the video agency you choose. Of course, they’re always happy to chat.
Source: Visual News
February 21, 2017
Create Unusual Satellite Doodles With Google’s New Experiment
The planet that we live on is such a beautiful and fantastic place. There are so many different patterns covering the globe that if you were to look at it from a distance, no two places would look alike and almost every pattern imaginable already exists. That’s where Land Lines, the latest Google Chrome Experiment, steps in.
Google’s Land Lines app gives users the abilities to create fascinating doodles using satellite imagery. With two available options, users can either draw out any line they want and Google will match their line to a corresponding image of someplace on earth or, with the app’s drag function, Google dynamically matches up patchwork images corresponding to a continuous line the user draws. The tiles may be images of rivers in Italy to a road in Milwaukee, but when put together, the final image is an “infinite line of connected rivers, highways, and coastlines,” according to the site page.

The app is fun, a great time killer, and is surprisingly very responsive considering all the data it needs to analyze in order to return the proper satellite image.
Make your own satellite doodle here and be sure to check out Google’s other Chrome Experiments.
[Via: Co.Design]
Source: Visual News
February 20, 2017
This 360 Video Will Inspire You To Have Great Ideas Anywhere
For many, the shower is where they get most of their ideas. The only problem is you can’t exactly take a shower whenever you need a boost of inspiration. Well, thanks to The One Show, now you can!
The virtual shower is made with 360 video technology, allowing users to brainstorm on the go. The work of Vancouver-based agency Rethink, the video was created as part of The One Show’s new campaign “One is all it takes.”

To accompany the video, The One Show also designed a Google Cardboard in the shape of the ad award show’s iconic Pencil award.
“The old adage is that we’re creative in the shower,” says CEO of The One Show Kevin Swanepoel. “So we decided to help creatives come up with award-winning ideas anytime, anywhere by bringing the shower directly to their device.”
Try the video out for yourself. Who knows, maybe you’ll come up with an award-winning idea.
[Via: AdWeek]
Source: Visual News