In my last blog post, I talked about how to identify and test for inhomogeneity of a point process, and I stated that the best way to characterize an inhomogeneous point process is to fit a good parametric model. When fitting an inhomogeneous point process model, the point pattern (really, the spatially varying intensity of the point pattern) is the response variable and the predictors are some type of spatial object, such as a raster surface, that can be evaluated anywhere within the test region. In ecology and geography, where the focus is often on hypothesis testing (rather than prediction, per se), it is often the predictors/covariates themselves that are of interest: the goal is to test whether the predictor has a significant effect on the spatially varying intensity of the point process.
For example, I have recently been working on a study with a group from south Florida and they want to determine whether elevation affects the intensity of burrowing by gopher tortoises in pine flatwoods (a type of pine savanna that is seasonally flooded). In this case, the response is the intensity of burrowing and the predictor is a raster derived from a digital elevation model (DEM); the goal is to test whether an increase (or decrease) in elevation affects the average intensity of burrowing. The elevation data were derived from LIDAR and were provided as a set of ERDAS IMAGINE (.img) files, where each pixel is 0.5 x 0.5 m and contains information about elevation.
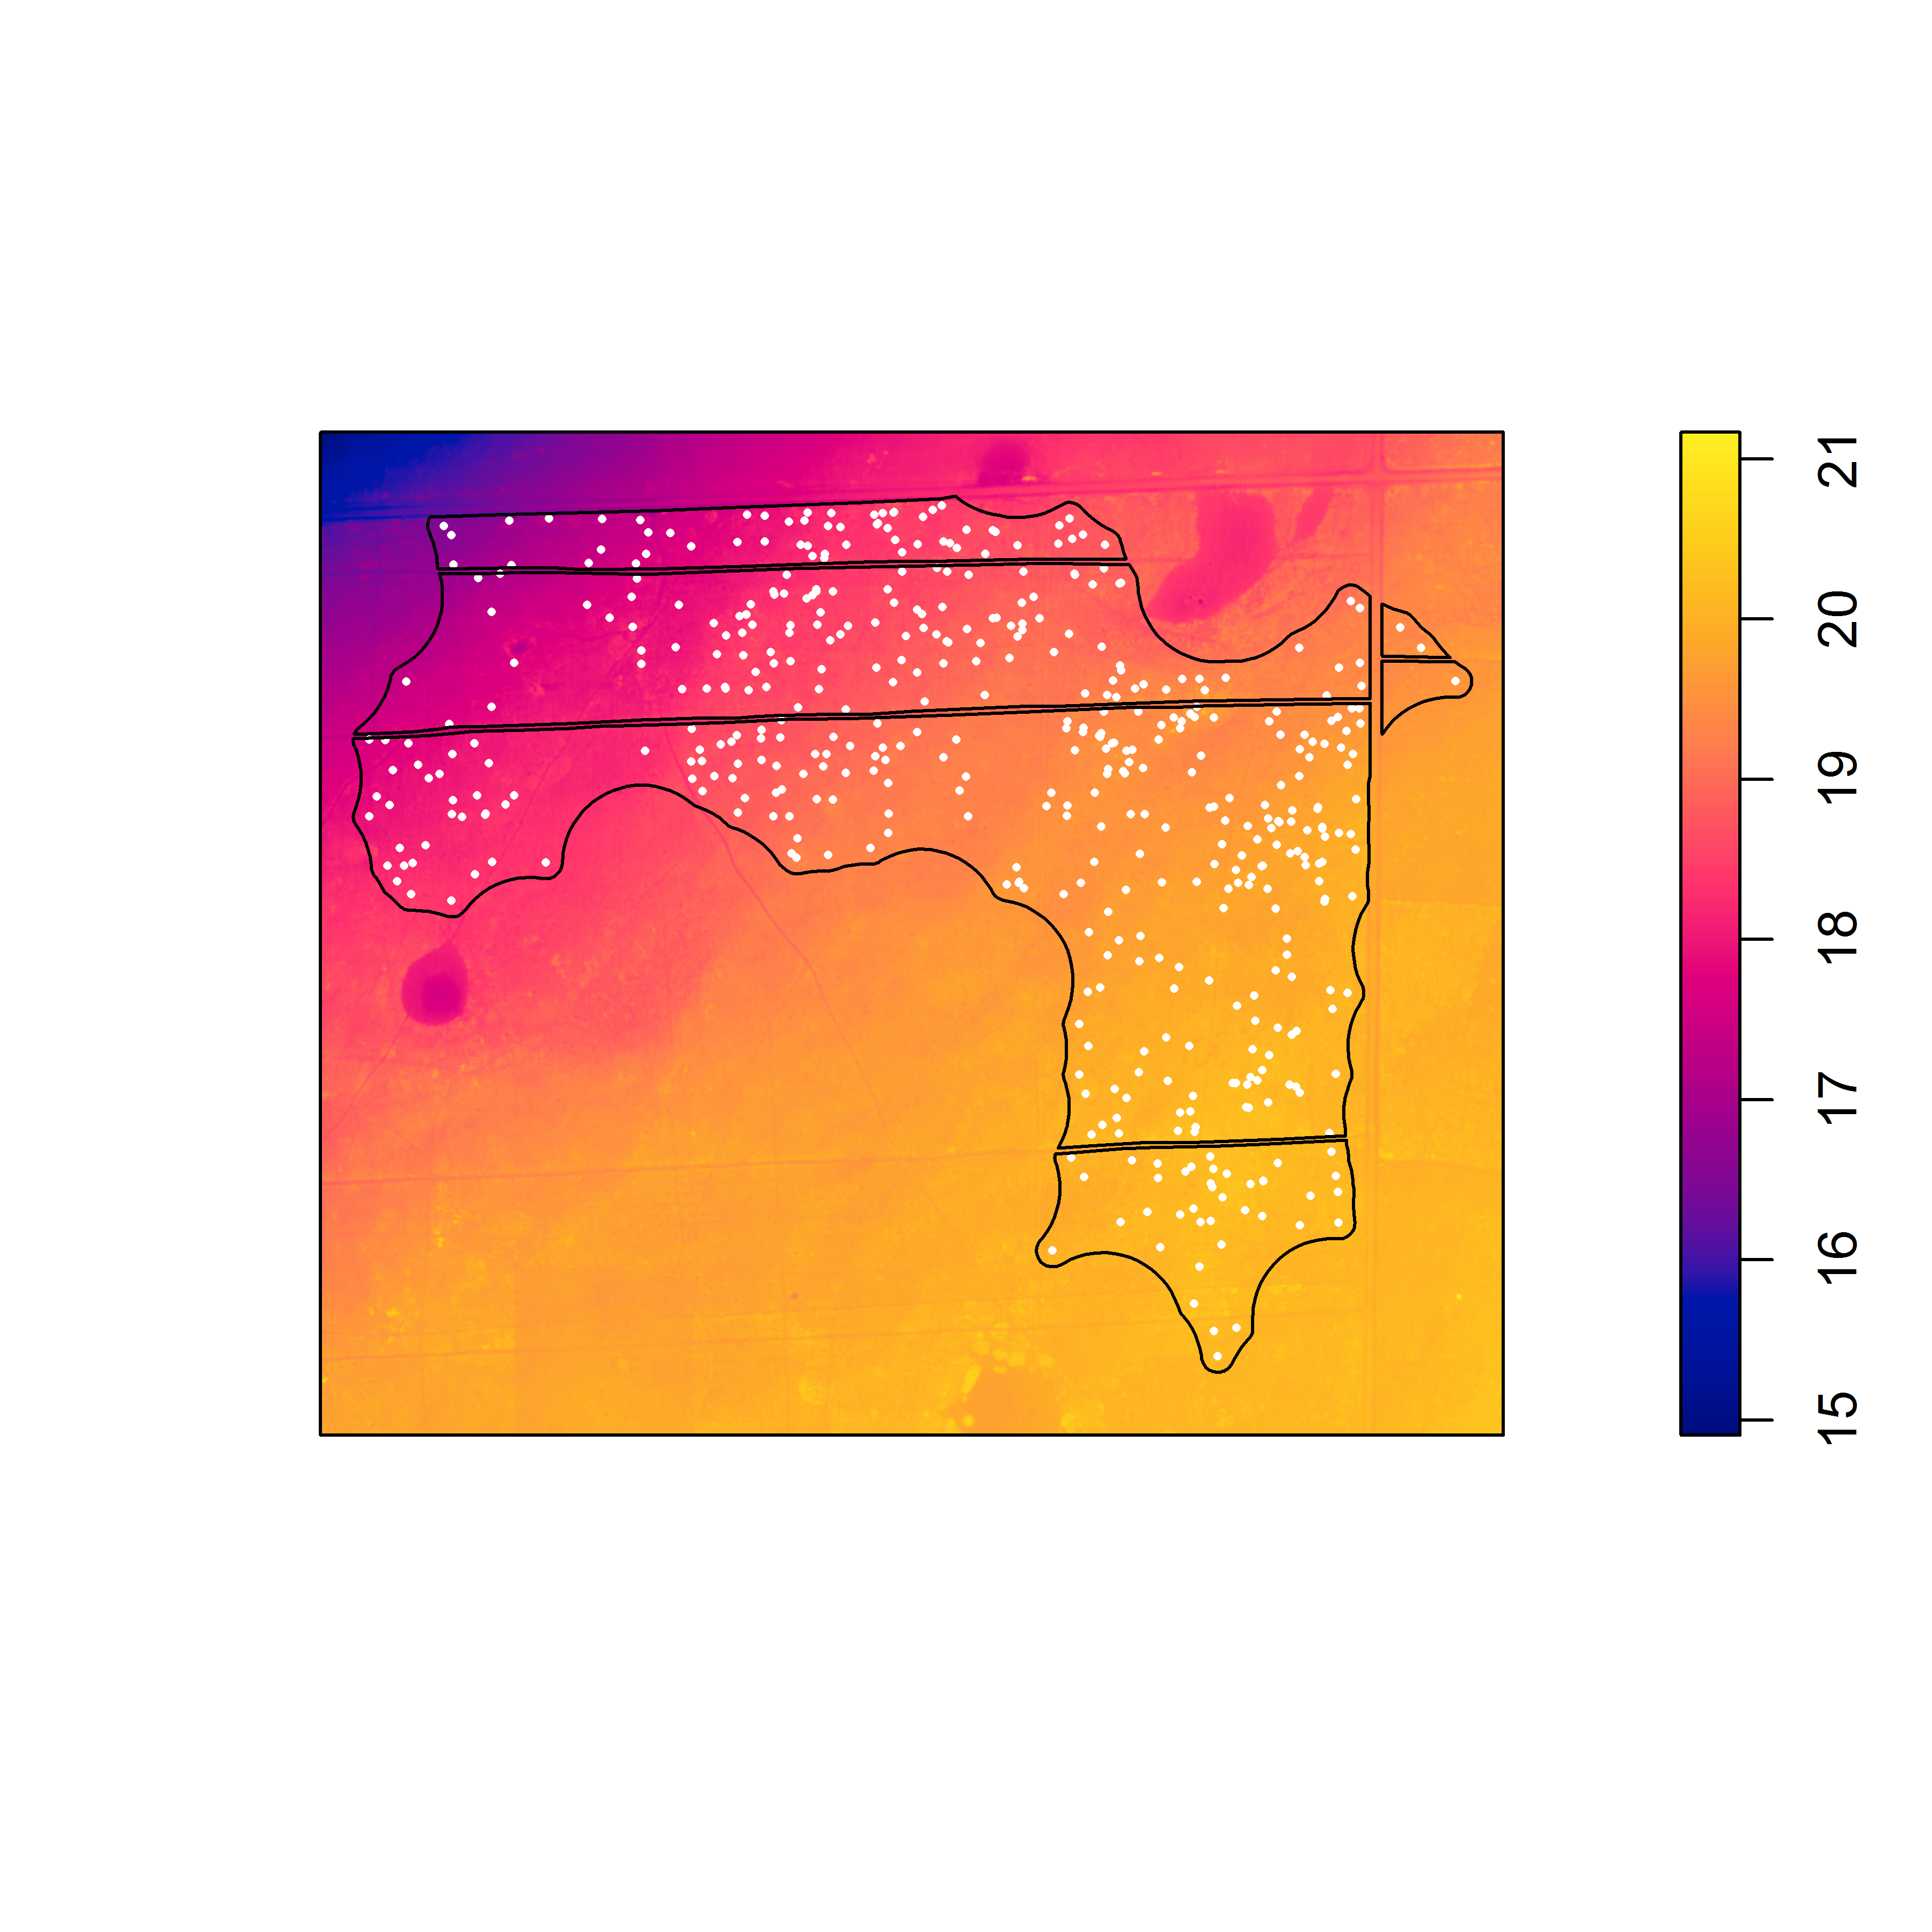
When I agreed to conduct the analysis, I thought it would be a rather simple: figure out how to process the DEMs for use in ‘spatstat’ and then fit point process models with the elevation rasters as predictors. I started the process in ArcGIS, where I converted the .img files to .tif and then clipped the .tif to the extent of each point pattern. Next, I used the readGDAL() function from the ‘rgdal’ package in R to convert the .tif files to a “SpatialGridDataFrame” object, which I then converted to an object of class “im” representing a two-dimensional pixel image in ‘spatstat’. Here is a pixel image of the elevation surface for the first point pattern that I examined in ‘spatstat’.

Pixel image (of class “im”) of elevation with locations of gopher tortoise burrows (white dots). The black lines represent the study area window boundaries. Note the trend in elevation from the northwest to the southeast.
If you fit a point process model with this elevation surface as a predictor, there is strong evidence against the null model (of a homogeneous Poisson point process) in favor of the model that includes the elevation surface. This results reflects the increase in mean intensity from the northwest to the southeast along the elevation gradient, associated with the change from bottomland to upland habitat. If you look closely, you can also see local variation in burrowing intensity along the elevation gradient, that seems to be associated with local topographic relief [i.e., high (dry) and low (wet) spots within a particular area]. At ground level, these subtle differences in elevation can be difficult to discern, but may be important in explaining local variation in burrowing intensity. To examine the effect of the local topographic relief, you first have to detrend the raster. To do this, the elevation surface will need to be processed outside of ‘spatstat’ and then returned as a pixel image (of class “im”) that can be used as a covariate in a point process model to examine the effect of local variation in elevation on burrowing intensity.
When I searched for how to detrend a raster on the internet, I was surprised to find little to no existing guidance or functionality. I knew that I could potentially fit a regression model based on the coordinates (vis a vis “trend surface analysis”) and then re-build the covariate surface based on the residuals, but I felt insecure about fitting a linear model in R to a raster surface with over 5 million pixels. Most of the links that I could find were focused on detrending a DEM to examine bathymetry in rivers, and other links led to tutorials on trend surface analysis, but almost entirely in context of interpolation from arbitrary sample locations. I saw some posts that discussed detrending a DEM in ArcGIS using the raster calculator or the arc.py library, but some extra tricks would be required to make it work if your input is a raster, and not points. Due to the lack of existing functionality, I decided to develop my own solution using some tools from the “raster” package in R (via intermediate object types from the “sp” package).
Before I describe my solution, I should say that I did eventually find an R package (called “EcoGenetics”) that has a function [called eco.detrend()] that does exactly what I was looking for, and is based on the same basic approach that I imagined. The eco.detrend() function is, in turn, based on code (for a trend surface analysis) from the book “Numerical Ecology with R” by Legendre and Borcard. Hence, if you are looking to quickly detrend a surface, I would recommend that you use eco.detrend(). That said, since many of the steps in the eco.detrend() function are automated and not readily apparent, the code that I am providing should help you to understand how the process works, and should be especially helpful if you want to customize the procedure in some way (e.g., if you want to fit a different type of model). Since my goal was to detrend the DEM for the purpose of a point pattern analysis in ‘spatstat’, my solution also provides the extra steps that will enable you to convert the detrended surface back into a pixel image object (of class “im”) in ‘spatstat’.
Below is the sample code for the solution I developed. For the sake of brevity, I have skipped the initial process of building the point pattern object in ‘spatstat’. My solution involves: 1) Converting the TIFF to a “SpatialGridDataFrame” and then to a “RasterLayer” object, 2) using the rasterToPoints() function to extract the pixel data and coordinates from the “RasterLayer”, 3) fitting a polynomial model (of a specified degree) and then rebuilding the data frame with the residuals (rather than the raw elevation data), 4) rebuilding the raster from the data frame using the rasterFromXYZ() function and restoring the projection information; 5) using the SpatialGridDataFrame() function to convert from “RasterLayer” object back to a “SpatialGridDataFrame” object; and 6) converting the “SpatialGridDataFrame” to an “im” object in ‘spatstat’.
There is only one step that I have modified after inspecting the eco.detrend() function: in my original code, I used the poly() function separately on the x and y coordinates and overlooked the fact that, when such an approach is used, the interaction term (between x and y) is not included. Passing the xy data as a matrix to poly() solves this problem (and I thank Leandro Roser for pointing out the missing interaction term). The eco.detrend() function also mean centers the coordinates before fitting the model, I have skipped this step.
#####################################################
library(spatstat)
library(rgdal)
library(raster)
#######################################
# ppp object was built in spatstat #
#######################################
### Example pipeline for detrending the raster.
# use ‘rgdal’ to convert the .tif to a SpatialGridDataFrame
alex_15 <- readGDAL(“Alexander2015.tif”)
# convert SpatialGridDataFrame to a RasterLayer
alex_15_ras <- raster(alex_15)
# extract coordinates and elevation band
x_y_z <- rasterToPoints(alex_15_ras)
#convert matrix to data frame
x_y_z <- as.data.frame(x_y_z)
# create a vector with the elevation data
band1 <- x_y_z[, 3]
# fit a linear model with the x and y coordinates as predictors
fit_test <- lm(band1 ~ x + y, data = x_y_z)
alex.residuals <- fit.test$residuals #extract the residuals
# To fit polynomial of degree two or higher, you must pass a matrix with # the xy coordinates through poly()
# isolate the columns with the x and y coordinates and covert to matrix
X_Y <- as.matrix(x_y_z[, c(1, 2)])
fit_test <- lm(band1 ~ poly(X_Y, degree = 2)) # change degree as required
alex_residuals <- fit_test$residuals
# Recreate the data frame with the coordinates and the residuals
x_y <- x_y_z[, 1:2] # isolate the coordinate columns
x_y$residuals <- alex_residuals # create column of residuals
x_y_r <- x_y # rename the data frame
head(x_y_r) # check to make sure it worked
# convert back to RasterLayer and restore the projection and datum
alex_15_detrend <- rasterFromXYZ(x_y_r, res = c(0.5, 0.5), crs = “+proj=utm +zone=17 +datum=WGS84”)
# convert back to SpatialGridDataFrame
alex_15_detrended <- as(alex_15_detrend, ‘SpatialGridDataFrame’)
# convert to im object in spatstat
alex_15_d <- as.im(alex_15_detrended)
#####################################################
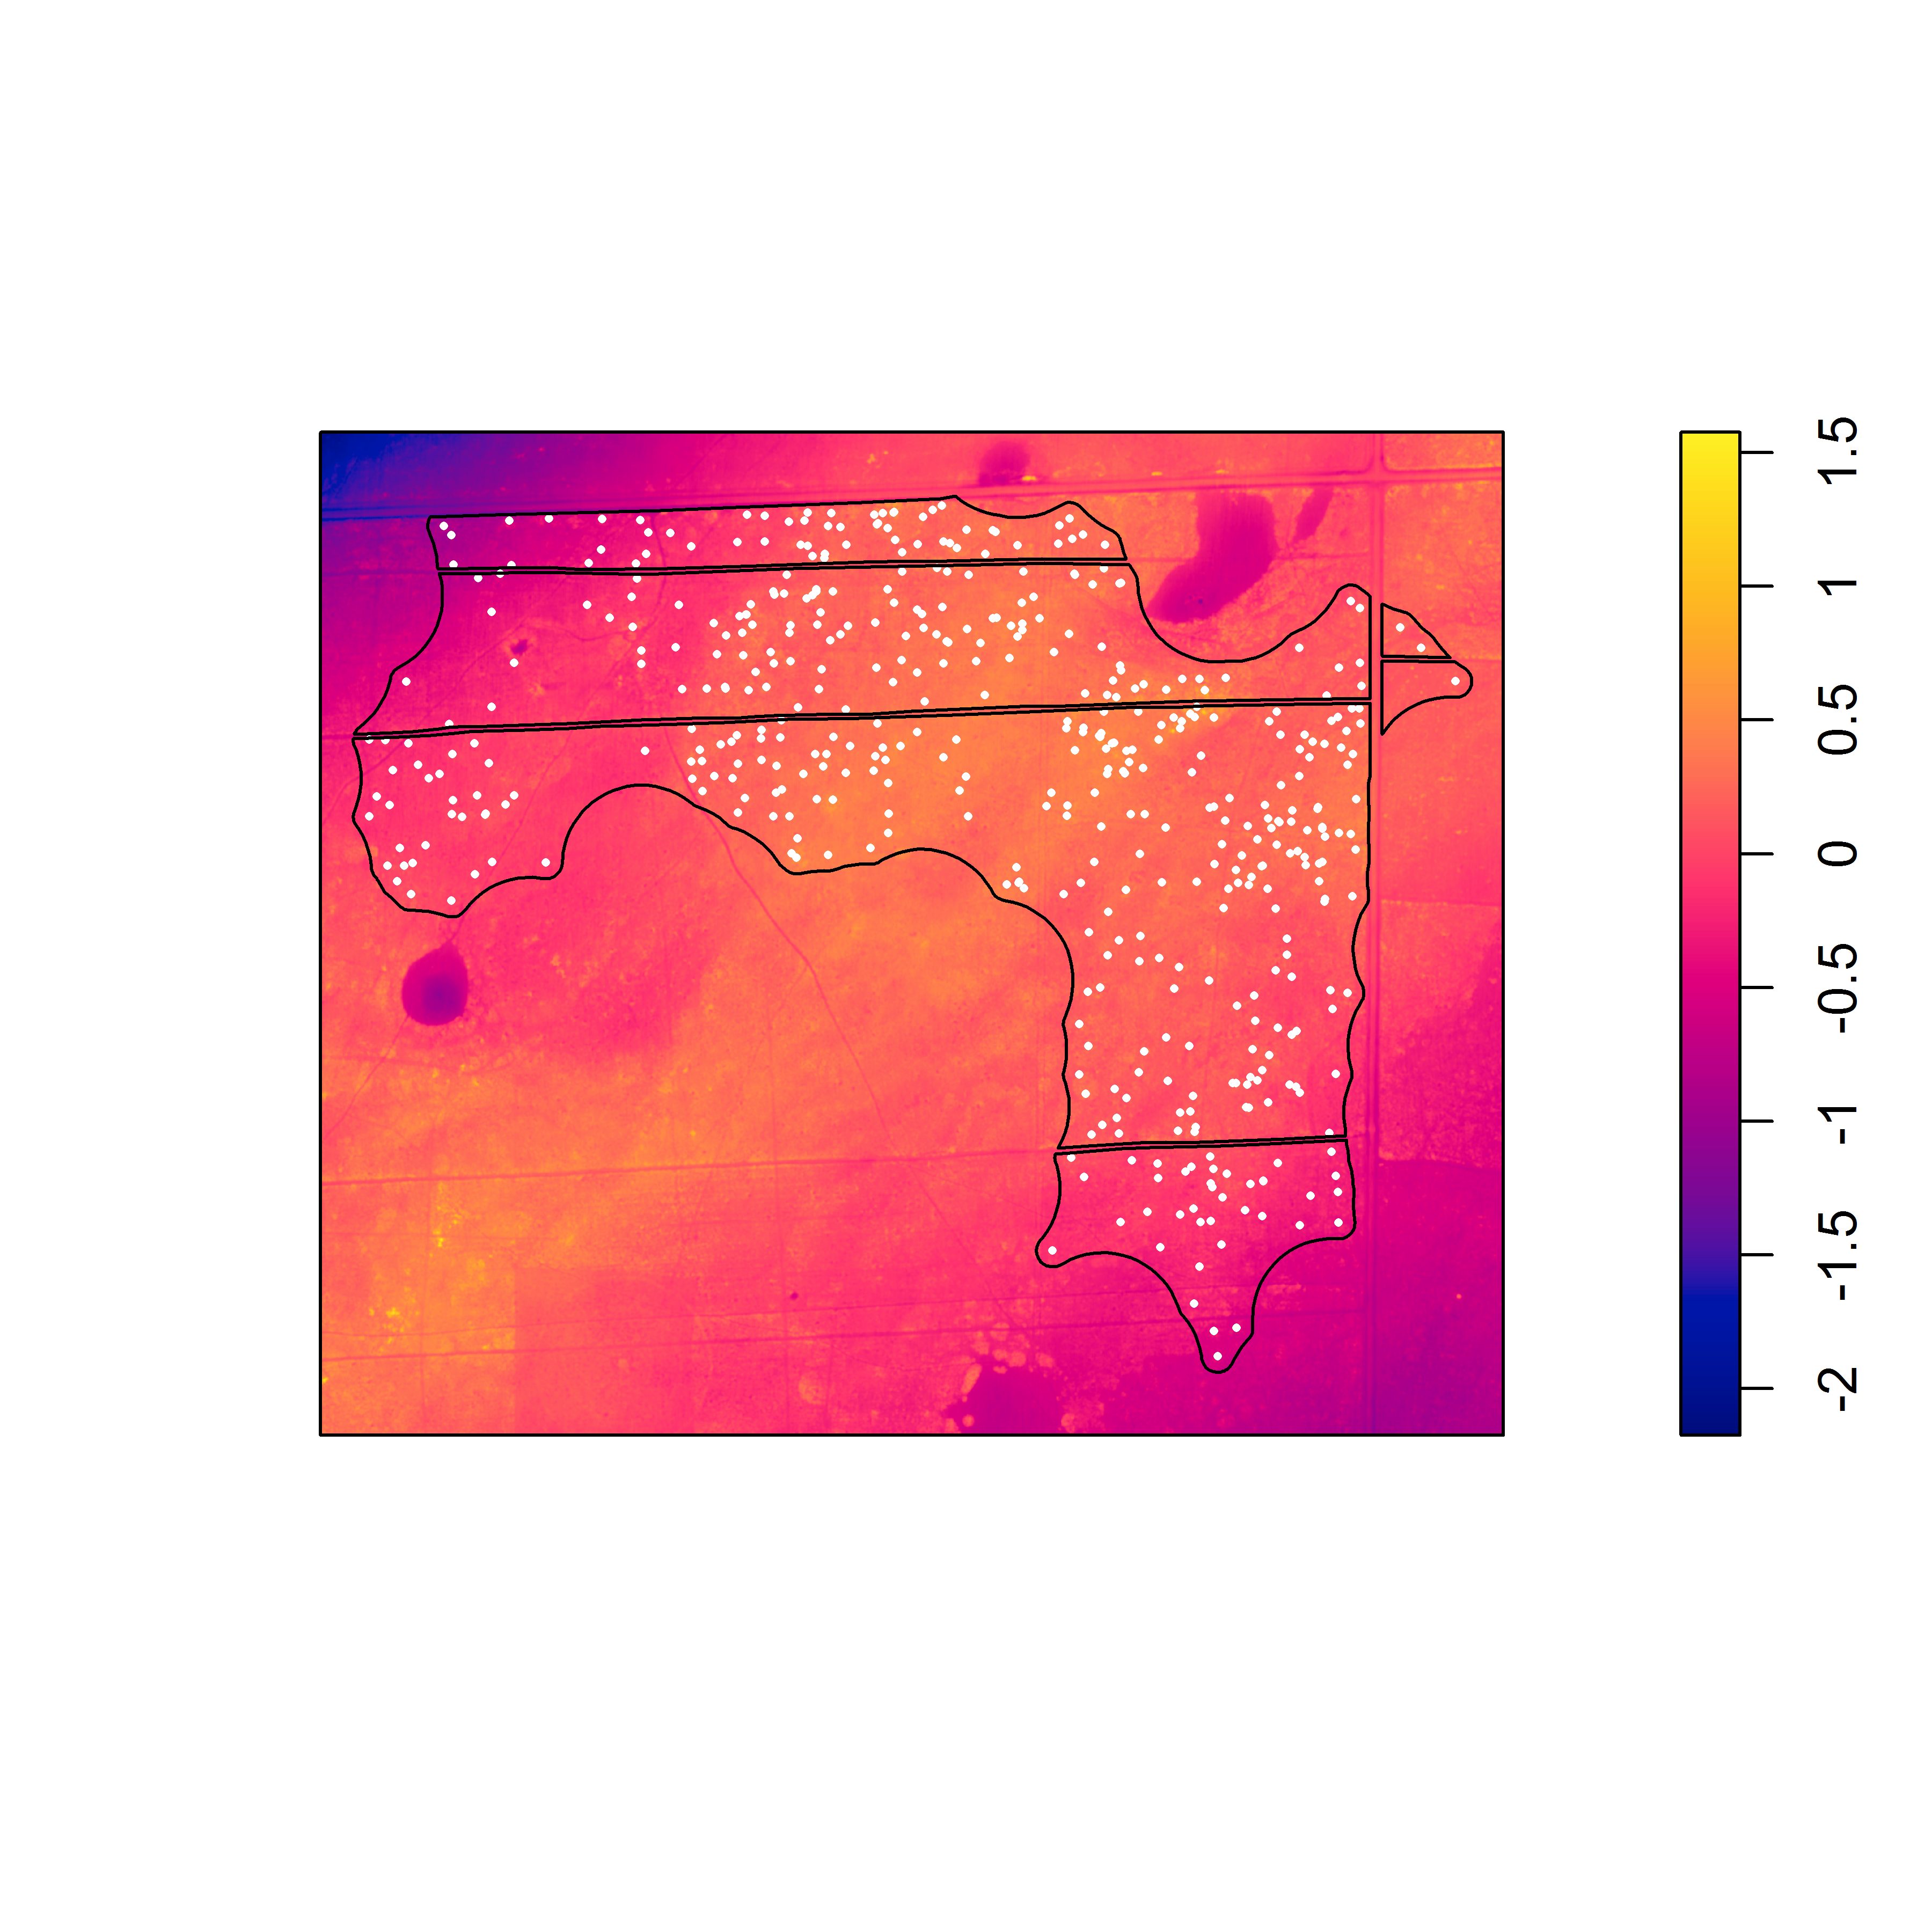
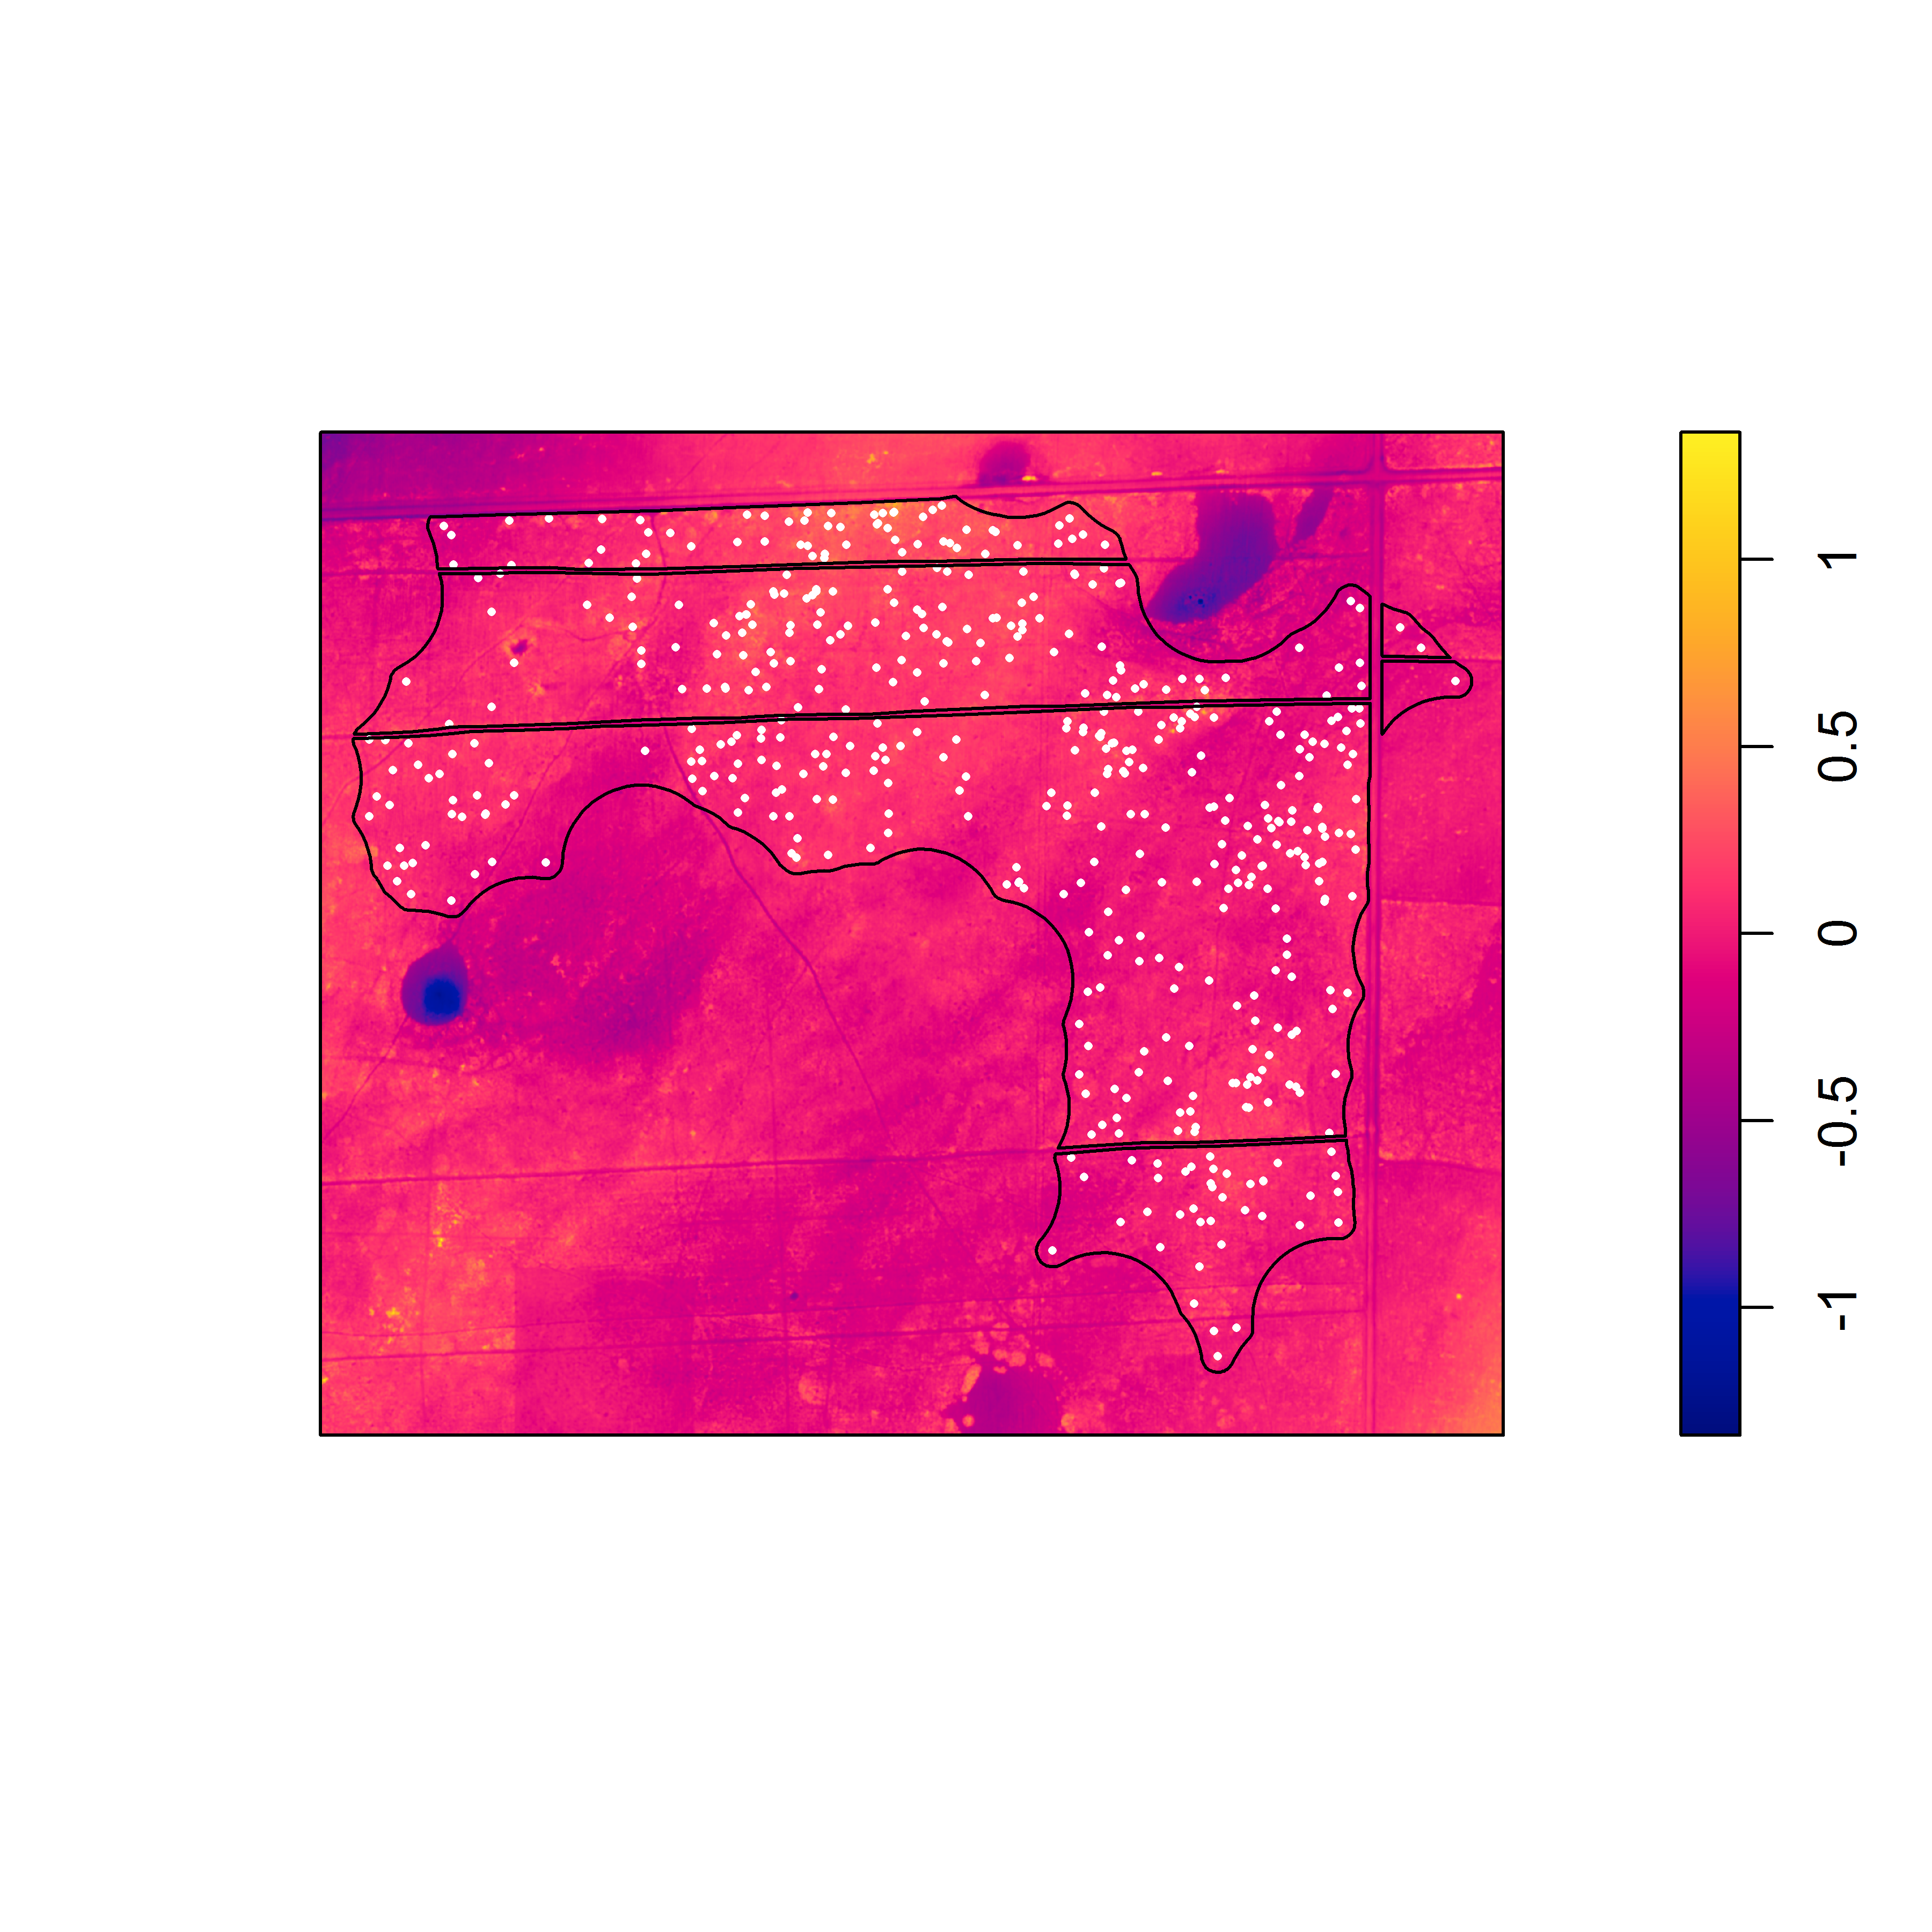
Here are the detrended rasters for the linear model and the second degree polynomial.

Pixel image of the elevation surface that was detrended via a linear model (with the x and y coordinates as predictors).

Pixel image of the elevation surface that was detrended based on a second degree polynomial of the x and y coordinates.
With the detrended surfaces, it is easier to see the association between the burrows and local topographic relief. For both detrended surfaces, there is strong evidence against the null model in favor of the model that includes the detrended surface as a covariate. Although the appearance of the raw elevation surface suggests a trend, the linear model seems to underestimate elevation in the northwest and southeast corners, suggesting that a higher degree polynomial or nonlinear model would better fit the surface.
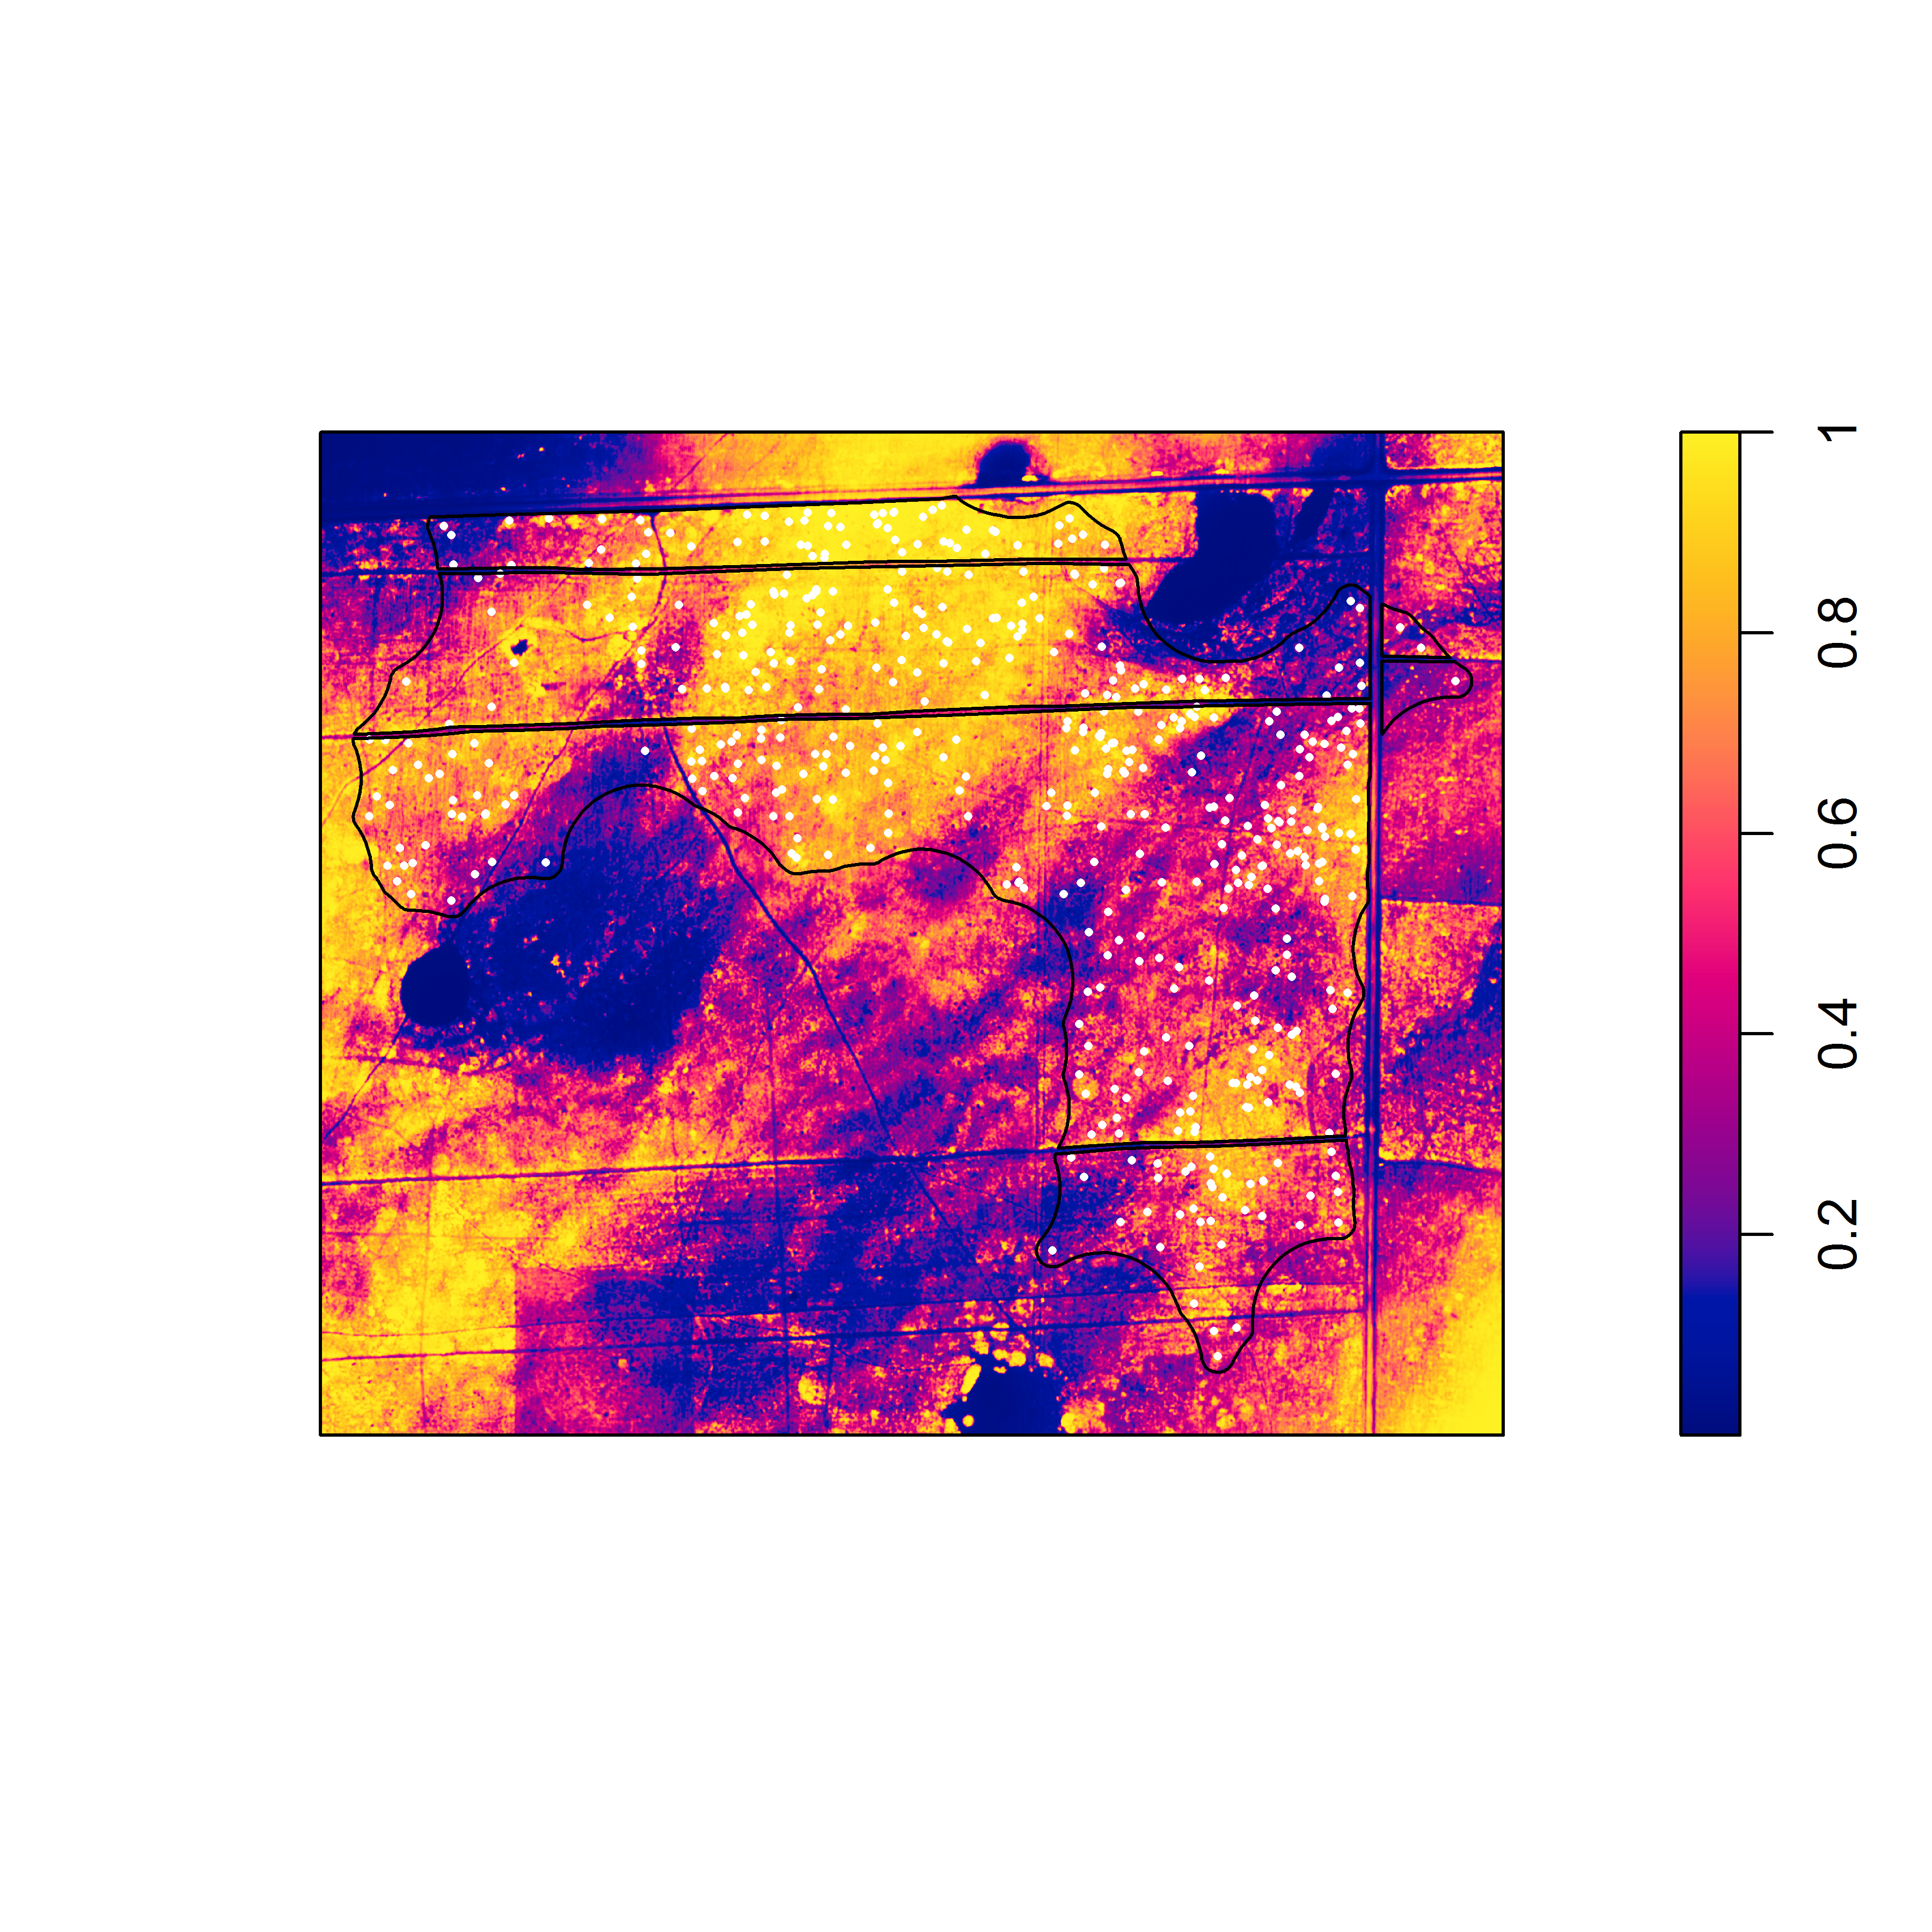
As far as I know, there is no simple trick for determining the optimal order of the polynomial to use when detrending. Given an appropriate thematic resolution (and color scheme), just the appearance of the raster (or the appearance of the detrended raster) might be the best clue, as in the example above. In terms of visualization, applying a probability integral transformation to the raster is a useful trick to the sharpen image:
pit <- ecdf(alex_15_d) # calculate ecdf for raster cell values
alex_15_d_pit <- eval.im(pit(alex_15_d)) # evaluate function for each cell
 Any sort of model selection scheme could be incorporated into the pipeline, but a rough sample-based heuristic would be to write a function to evaluate model fit (based on something like adjusted R-squared value or rmse error) against the polynomial order to find the threshold where there are diminishing returns. Here I wrote a function (poly_r2) that evaluates the adjusted R-squared value for a polynomial function up to five degrees.
> poly_r2(x_y_z, 5)
[1] 0.8484003 0.9700987 0.9763606 0.9787306 0.9831541
Based on the result shown, one might conclude that there are diminishing returns beyond a polynomial degree of two. Over-fitting the distribution is also a bad idea if you are interested in the residual elevation. Rescaling the elevation surface to avoid negative values (e.g., by adding the residuals to the minimum elevation or minimum residual value) does not change the estimate of the regression coefficient in the point process model (or the test of significance of the regression coefficient), but it does affect the estimate of the intercept. In our case, we are mainly interested in whether local topographic relief affects burrowing intensity, and the results suggest that there are both global and local effects of elevation on burrowing intensity.
There are lots of potential situations, beyond detrending a raster for the purpose of fitting a point process model, where detrending a raster surface might be useful. In the “EcoGenetics” package, there is an interesting example where a global trend is removed so that a test of local spatial autocorrelation can be conducted. Moreover, this sort of approach (based on trend surface analysis) could be used for any sort of geostatistical data and does not have to be limited to the special case of raster data. While the solution I have provided is not necessarily novel, I hope it is useful to somebody looking to detrend a raster in R, especially in the context of point pattern analysis. Point process modeling is a powerful approach for examining inhomogeneity, but such an approach is only worthwhile if important covariates can be measured and mapped effectively.
[If you are interested in the application to gopher tortoise conservation, see Castellon et al. (2020) in Copeia]
